Toyota 2007 Annual Report Download - page 20
Download and view the complete annual report
Please find page 20 of the 2007 Toyota annual report below. You can navigate through the pages in the report by either clicking on the pages listed below, or by using the keyword search tool below to find specific information within the annual report.-
 1
1 -
2
-
3
-
4
-
5
-
6
-
7
-
8
-
9
-
 10
10 -
 11
11 -
 12
12 -
 13
13 -
 14
14 -
 15
15 -
 16
16 -
 17
17 -
 18
18 -
 19
19 -
 20
20 -
 21
21 -
 22
22 -
 23
23 -
 24
24 -
 25
25 -
 26
26 -
 27
27 -
 28
28 -
 29
29 -
 30
30 -
31
-
32
-
33
-
34
-
35
-
36
-
37
-
38
-
39
-
40
-
41
-
42
-
43
-
44
-
45
-
46
-
47
-
48
-
49
-
50
-
51
-
52
-
53
-
54
-
55
-
56
-
57
-
58
-
59
-
60
-
61
-
62
-
63
-
64
-
65
-
66
-
67
-
68
-
69
-
70
-
71
-
72
-
73
-
74
-
75
-
76
-
77
-
78
-
79
-
80
-
81
-
82
-
83
-
84
-
85
-
86
-
87
-
88
-
89
-
90
-
91
-
92
-
93
-
94
-
95
-
96
-
97
-
98
-
99
-
100
-
101
-
102
-
103
-
104
-
105
-
106
-
107
-
108
-
109
-
110
-
111
-
112
-
113
-
114
-
115
-
116
-
117
-
118
-
119
-
120
-
121
-
122
-
123
-
124
-
125
-
126
-
127
-
128
-
129
-
130
-
131
-
132
-
133
-
134
-
135
-
136
-
137
-
138
-
139
-
140
 |
 |

18 ANNUAL REPORT 2007
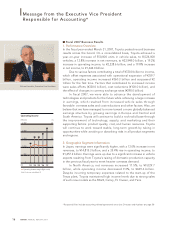
2. Efficiency: Maintaining and improving profitability and capital efficiency
In fiscal 2007, Toyota’s operating income margin was 9.3% and Return
on Equity (“ROE”) was 14.7%. Toyota has achieved significant
improvements since fiscal 2002 when its operating income margin was
7.7% and ROE 7.8%. We will maintain high levels of profitability by
introducing products efficiently through the development of core global
models, realizing the benefits of innovative VI Activity cost reductions,
expanding production systems that link plants in Japan and abroad, and
developing and introducing highly efficient production engineering of
the kind typified by the Takaoka plant’s innovative production line.
Furthermore, Toyota will continue to acquire its own shares with a view
to maintaining and improving profitability and capital efficiency.
3. Stability: Maintaining a solid financial base
Toyota maintains a solid financial base by ensuring sufficient liquidity
and stable shareholders’ equity. At fiscal year-end, liquid assets* were
approximately ¥4.2 trillion, while shareholders’ equity amounted to
approximately ¥11.8 trillion. Toyota’s sound financial position enables it
to continue investing for growth, even during rapid fluctuations in
business and market conditions, and underpins the high credit ratings
that enable access to low-cost, stable financing. In view of the expected
growth in automotive markets worldwide, we believe that maintaining
adequate liquid funds is essential for the implementation of forward-
looking investment to improve products, and to develop next-generation
technology, as well as to establish production and sales systems in Japan
and overseas for the further global expansion of operations.
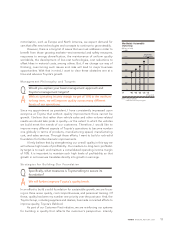
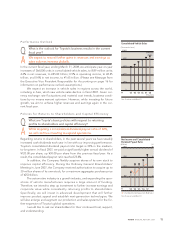
■ Dividends and Acquisition of Shares
Toyota regards the distribution of profits to its shareholders as one of its
priority management policies and continuously strives to increase per
share earnings. With respect to the payment of dividends, Toyota seeks
to enhance the distribution of profits by striving to secure a consolidated
dividend payout ratio of 30% over the medium-to-long term while giving
due consideration to such factors as the business results of each term
and new investment plans. Reflecting its dividend policy, in fiscal 2007
Toyota paid a significantly higher annual dividend of ¥120.00 per share,
up ¥30.00 per share from the previous fiscal year. This annual dividend
was Toyota’s highest to date and marked the eighth consecutive year of
increased dividends. Furthermore, the consolidated dividend payout
ratio rose from the previous fiscal year’s 21.3% to 23.4%.
150 50
120 40
90 30
60 20
30 10
00
Dividends per Share
(¥) (%)
FY ’04’03 ’05 ’06 ’07
Consolidated dividend payout ratio
(Right scale)
120
65
90
45
36
+8
+9
+20
+25
+30
Note: Fiscal years ended March 31
* Excluding finance subsidiaries