Toyota 2007 Annual Report Download - page 34
Download and view the complete annual report
Please find page 34 of the 2007 Toyota annual report below. You can navigate through the pages in the report by either clicking on the pages listed below, or by using the keyword search tool below to find specific information within the annual report.-
 1
1 -
2
-
3
-
4
-
5
-
6
-
7
-
8
-
9
-
10
-
11
-
12
-
13
-
14
-
15
-
16
-
17
-
18
-
19
-
20
-
21
-
22
-
23
-
 24
24 -
 25
25 -
 26
26 -
 27
27 -
 28
28 -
 29
29 -
 30
30 -
 31
31 -
 32
32 -
 33
33 -
 34
34 -
 35
35 -
 36
36 -
 37
37 -
 38
38 -
 39
39 -
 40
40 -
 41
41 -
 42
42 -
 43
43 -
 44
44 -
45
-
46
-
47
-
48
-
49
-
50
-
51
-
52
-
53
-
54
-
55
-
56
-
57
-
58
-
59
-
60
-
61
-
62
-
63
-
64
-
65
-
66
-
67
-
68
-
69
-
70
-
71
-
72
-
73
-
74
-
75
-
76
-
77
-
78
-
79
-
80
-
81
-
82
-
83
-
84
-
85
-
86
-
87
-
88
-
89
-
90
-
91
-
92
-
93
-
94
-
95
-
96
-
97
-
98
-
99
-
100
-
101
-
102
-
103
-
104
-
105
-
106
-
107
-
108
-
109
-
110
-
111
-
112
-
113
-
114
-
115
-
116
-
117
-
118
-
119
-
120
-
121
-
122
-
123
-
124
-
125
-
126
-
127
-
128
-
129
-
130
-
131
-
132
-
133
-
134
-
135
-
136
-
137
-
138
-
139
-
140
 |
 |

32 ANNUAL REPORT 2007
25,000
20,000
15,000
5,000
10,000
0
500
1,000
1,500
2,000
2,500
0
Revenues and
Operating Income
(¥ Billion) (¥ Billion)
FY ’04’03 ’05 ’06 ’07
Operating income (Right scale)Revenues
1,500
1,200
900
300
600
0
50
100
150
200
250
0
’04’03 ’05 ’06 ’07
Revenues and
Operating Income
(¥ Billion) (¥ Billion)
FY
Operating income (Right scale)Revenues
1,500
1,200
600
300
900
0
10
30
20
40
50
0
’04’03 ’05 ’06 ’07
Revenues and
Operating Income
(¥ Billion) (¥ Billion)
FY
Operating income (Right scale)Revenues
Note: Fiscal years ended March 31
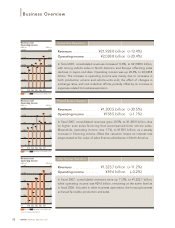
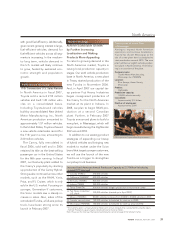
Automotive Operations
Business Overview
In fiscal 2007, consolidated revenues increased 13.4%, to ¥21,928.0 billion,
with strong vehicle sales in North America and Europe offsetting sales
declines in Japan and Asia. Operating income was up 20.4%, to ¥2,038.8
billion. The increase in operating income was mainly due to increases in
both production volume and vehicle units sold, the effect of changes in
exchange rates, and cost reduction efforts, partially offset by an increase in
expenses related to business expansion.
Revenues . . . . . . . . . . . . . . . . . .¥21,928.0 billion (+13.4%)
Operating income . . . . . . . . . ¥2,038.8 billion (+20.4%)
Financial Services Operations
In fiscal 2007, consolidated revenues grew 30.5%, to ¥1,300.5 billion, due
to higher auto sales financing that accompanied brisk vehicle sales.
Meanwhile, operating income rose 1.7%, to ¥158.5 billion, as a steady
increase in financing volume offset the valuation losses on interest rate
swaps stated at fair value of sales finance subsidiaries in North America.
Revenues . . . . . . . . . . . . . . . . . . ¥1,300.5 billion (+30.5%)
Operating income . . . . . . . . . ¥158.5 billion (+1.7%)
Other Business Operations
In fiscal 2007, consolidated revenues were up 11.2%, to ¥1,323.7 billion,
while operating income was ¥39.6 billion, remaining at the same level as
in fiscal 2006. Included in other business operations, the housing business
achieved favorable production and sales.
Revenues . . . . . . . . . . . . . . . . . . ¥1,323.7 billion (+11.2%)
Operating income . . . . . . . . . ¥39.6 billion (–0.2%)