Toyota 2007 Annual Report Download - page 100
Download and view the complete annual report
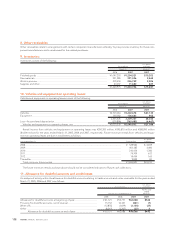
Please find page 100 of the 2007 Toyota annual report below. You can navigate through the pages in the report by either clicking on the pages listed below, or by using the keyword search tool below to find specific information within the annual report.-
 1
1 -
2
-
3
-
4
-
5
-
6
-
7
-
8
-
9
-
10
-
11
-
12
-
13
-
14
-
15
-
16
-
17
-
18
-
19
-
20
-
21
-
22
-
23
-
24
-
25
-
26
-
27
-
28
-
29
-
30
-
31
-
32
-
33
-
34
-
35
-
36
-
37
-
38
-
39
-
40
-
41
-
42
-
43
-
44
-
45
-
46
-
47
-
48
-
49
-
50
-
51
-
52
-
53
-
54
-
55
-
56
-
57
-
58
-
59
-
60
-
61
-
62
-
63
-
64
-
65
-
66
-
67
-
68
-
69
-
70
-
71
-
72
-
73
-
74
-
75
-
76
-
77
-
78
-
79
-
80
-
81
-
82
-
83
-
84
-
85
-
86
-
87
-
88
-
89
-
 90
90 -
 91
91 -
 92
92 -
 93
93 -
 94
94 -
 95
95 -
 96
96 -
 97
97 -
 98
98 -
 99
99 -
 100
100 -
 101
101 -
 102
102 -
 103
103 -
 104
104 -
 105
105 -
 106
106 -
 107
107 -
 108
108 -
 109
109 -
 110
110 -
111
-
112
-
113
-
114
-
115
-
116
-
117
-
118
-
119
-
120
-
121
-
122
-
123
-
124
-
125
-
126
-
127
-
128
-
129
-
130
-
131
-
132
-
133
-
134
-
135
-
136
-
137
-
138
-
139
-
140
 |
 |

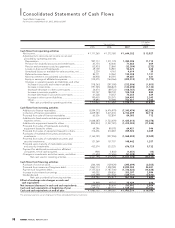
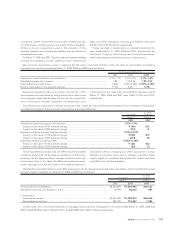
98 ANNUAL REPORT 200798 ANNUAL REPORT 2007
U.S. dollars
Yen in millions in millions
2005 2006 2007 2007
Cash flows from operating activities
Net income.................................................................................. ¥ 1,171,260 ¥ 1,372,180 ¥ 1,644,032 $ 13,927
Adjustments to reconcile net income to net cash
provided by operating activities
Depreciation............................................................................ 997,713 1,211,178 1,382,594 11,712
Provision for doubtful accounts and credit losses ............... 63,154 62,646 71,862 609
Pension and severance costs, less payments....................... (52,933) 23,860 (32,054) (272)
Losses on disposal of fixed assets......................................... 49,159 54,981 50,472 428
Unrealized losses on available-for-sale securities, net ........ 2,324 4,163 4,614 39
Deferred income taxes........................................................... 84,711 33,262 132,308 1,121
Minority interest in consolidated subsidiaries...................... 64,938 84,393 49,687 421
Equity in earnings of affiliated companies ........................... (139,471) (164,366) (209,515) (1,775)
Changes in operating assets and liabilities, and other
Increase in accounts and notes receivable....................... (178,363) (297,598) (212,856) (1,803)
Increase in inventories........................................................ (191,545) (248,823) (133,698) (1,133)
(Increase) decrease in other current assets ...................... 34,674 (89,723) (108,767) (921)
Increase in accounts payable............................................. 153,747 188,702 104,188 883
Increase (decrease) in accrued income taxes................... 41,228 54,052 74,255 629
Increase in other current liabilities .................................... 190,450 203,075 264,490 2,240
Other.................................................................................... 79,894 23,498 156,561 1,326
Net cash provided by operating activities ................... 2,370,940 2,515,480 3,238,173 27,431
Cash flows from investing activities
Additions to finance receivables ............................................... (5,594,375) (6,476,979) (7,343,474) (62,206)
Collection of finance receivables .............................................. 4,609,383 5,615,276 6,152,499 52,118
Proceeds from sale of finance receivables ............................... 65,536 102,854 84,083 712
Additions to fixed assets excluding equipment
leased to others ........................................................................ (1,068,287) (1,523,459) (1,425,814) (12,078)
Additions to equipment leased to others ................................ (854,953) (1,247,781) (1,410,003) (11,944)
Proceeds from sales of fixed assets excluding
equipment leased to others..................................................... 69,396 89,578 64,421 546
Proceeds from sales of equipment leased to others............... 316,456 410,683 359,923 3,049
Purchases of marketable securities and security
investments ............................................................................... (1,165,791) (957,296) (1,068,205) (9,049)
Proceeds from sales of marketable securities and
security investments ................................................................. 121,369 157,707 148,442 1,257
Proceeds upon maturity of marketable securities
and security investments.......................................................... 452,574 533,325 676,729 5,732
Payment for additional investments in affiliated
companies, net of cash acquired............................................. (901) (1,802) (1,651) (14)
Changes in investments and other assets, and other.............. (11,603) (77,606) (51,328) (435)
Net cash used in investing activities ............................. (3,061,196) (3,375,500) (3,814,378) (32,312)
Cash flows from financing activities
Purchase of common stock........................................................ (264,106) (129,629) (295,699) (2,505)
Proceeds from issuance of long-term debt.............................. 1,863,710 1,928,788 2,890,000 24,481
Payments of long-term debt...................................................... (1,155,223) (1,187,506) (1,726,823) (14,628)
Increase in short-term borrowings ............................................ 140,302 509,826 353,397 2,994
Dividends paid ............................................................................ (165,299) (244,568) (339,107) (2,873)
Net cash provided by financing activities..................... 419,384 876,911 881,768 7,469
Effect of exchange rate changes on cash and
cash equivalents .......................................................................... 24,849 68,743 25,429 216
Net increase (decrease) in cash and cash equivalents............ (246,023) 85,634 330,992 2,804
Cash and cash equivalents at beginning of year ..................... 1,729,776 1,483,753 1,569,387 13,294
Cash and cash equivalents at end of year ................................ ¥ 1,483,753 ¥ 1,569,387 ¥ 1,900,379 $ 16,098
The accompanying notes are an integral part of these consolidated financial statements.
Consolidated Statements of Cash Flows
Toyota Motor Corporation
For the years ended March 31, 2005, 2006 and 2007