Toyota 2007 Annual Report Download - page 87
Download and view the complete annual report
Please find page 87 of the 2007 Toyota annual report below. You can navigate through the pages in the report by either clicking on the pages listed below, or by using the keyword search tool below to find specific information within the annual report.-
 1
1 -
2
-
3
-
4
-
5
-
6
-
7
-
8
-
9
-
10
-
11
-
12
-
13
-
14
-
15
-
16
-
17
-
18
-
19
-
20
-
21
-
22
-
23
-
24
-
25
-
26
-
27
-
28
-
29
-
30
-
31
-
32
-
33
-
34
-
35
-
36
-
37
-
38
-
39
-
40
-
41
-
42
-
43
-
44
-
45
-
46
-
47
-
48
-
49
-
50
-
51
-
52
-
53
-
54
-
55
-
56
-
57
-
58
-
59
-
60
-
61
-
62
-
63
-
64
-
65
-
66
-
67
-
68
-
69
-
70
-
71
-
72
-
73
-
74
-
75
-
76
-
 77
77 -
 78
78 -
 79
79 -
 80
80 -
 81
81 -
 82
82 -
 83
83 -
 84
84 -
 85
85 -
 86
86 -
 87
87 -
 88
88 -
 89
89 -
 90
90 -
 91
91 -
 92
92 -
 93
93 -
 94
94 -
 95
95 -
 96
96 -
 97
97 -
98
-
99
-
100
-
101
-
102
-
103
-
104
-
105
-
106
-
107
-
108
-
109
-
110
-
111
-
112
-
113
-
114
-
115
-
116
-
117
-
118
-
119
-
120
-
121
-
122
-
123
-
124
-
125
-
126
-
127
-
128
-
129
-
130
-
131
-
132
-
133
-
134
-
135
-
136
-
137
-
138
-
139
-
140
 |
 |
ANNUAL REPORT 2007 85
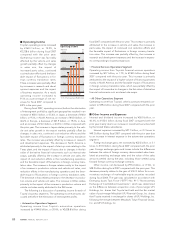
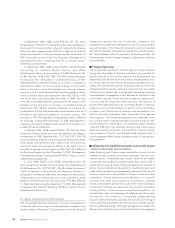
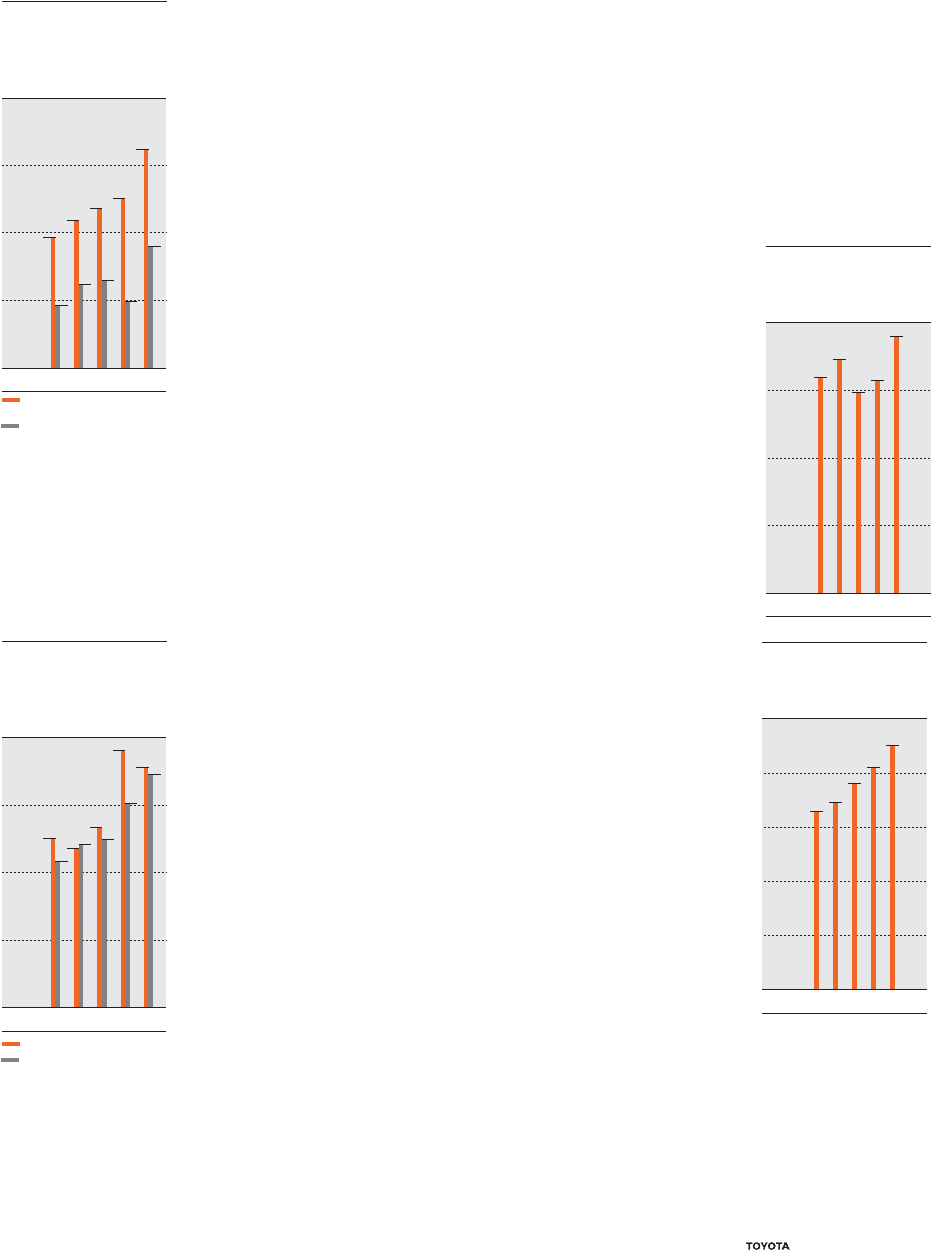
Net cash provided by operat-
ing activities was ¥3,238.1 billion for
fiscal 2007, compared with ¥2,515.4
billion for the prior year. The
increase in net cash provided by
operating activities resulted primar-
ily from increased operating cash
flows attributed to the increase of
net income.
Net cash used in investing
activities was ¥3,814.3 billion for
fiscal 2007, compared with ¥3,375.5
billion for the prior year. The
increase in net cash used in invest-
ing activities resulted primarily from
the increase in additions to finance
receivables, the increase in addi-
tions to equipment leased to others
and in the increase in purchases of
marketable securities and security
investments, which was partially
offset by an increase in the collec-
tion of finance receivables.
Net cash provided by financing
activities was ¥881.7 billion for fiscal 2007, compared with ¥876.9
billion for the prior year. The increase in net cash provided by
financing activities resulted primarily from an increase in pro-
ceeds from issuance of long-term debt, which was partially offset
by an increase in repayments of long-term debt.
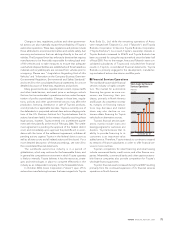
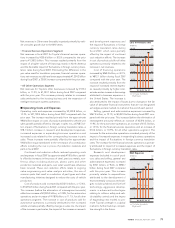
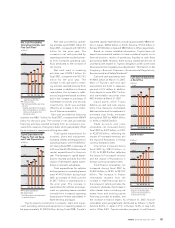
Total capital expenditures for
property, plant and equipment,
excluding vehicles and equipment on
operating leases, were ¥1,425.8 bil-
lion during fiscal 2007, a decrease of
6.4% over the ¥1,523.4 billion in total
capital expenditures for the prior
year. The decrease in capital expen-
ditures resulted primarily from the
impact of decreased capital expen-
ditures in domestic subsidiaries.
Total expenditures for vehicles
and equipment on operating leases
were ¥1,410.0 billion during fiscal
2007, an increase of 13.0% over the
¥1,247.7 billion in expenditures in
the prior year. The increase in
expenditures for vehicles and equip-
ment on operating leases resulted
primarily from increased operating
lease assets in finance subsidiaries in
North America and Japan.
Toyota expects investments in property, plant and equip-
ment, excluding vehicles and equipment on operating leases, to
be approximately ¥1,500.0 billion during fiscal 2008. Toyota’s
expected capital expenditures include approximately ¥800.0 bil-
lion in Japan, ¥400.0 billion in North America, ¥110.0 billion in
Europe, ¥110.0 billion in Asia and ¥80.0 billion in Other, respectively.
Based on current available information, Toyota does not
expect environmental matters to have a material impact on its
financial position, results of operations, liquidity or cash flows
during fiscal 2008. However, there exists a substantial amount of
uncertainty with respect to Toyota’s obligations under current and
future environment regulations as described in “Information on the
Company—Business Overview—Governmental Regulations,
Environmental and Safety Standards”.
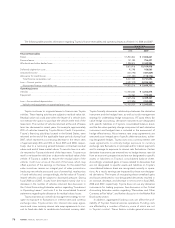
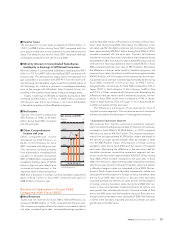
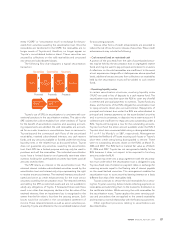
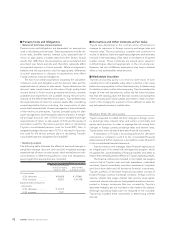
Cash and cash equivalents were
¥1,900.3 billion at March 31, 2007.
Most of Toyota’s cash and cash
equivalents are held in Japanese
yen and in U.S. dollars. In addition,
time deposits were ¥26.7 billion
and marketable securities were
¥435.4 billion at March 31, 2007.
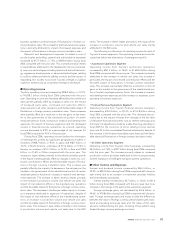
Liquid assets, which Toyota
defines as cash and cash equiva-
lents, time deposits, marketable
debt securities and its investment in
monetary trust funds, increased
during fiscal 2007 by ¥408.4 billion,
or 10.0%, to ¥4,505.2 billion.
Trade accounts and notes
receivable, net increased during
fiscal 2007 by ¥43.2 billion, or 2.2%,
to ¥2,023.8 billion, reflecting the
impact of increased revenues and
the impact of fluctuations in foreign
currency translation rates.
Inventories increased during
fiscal 2007 by ¥183.0 billion, or
11.3%, to ¥1,803.9 billion, reflecting
the impact of increased volumes
and the impact of fluctuations in
foreign currency translation rates.
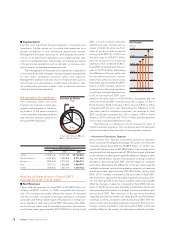
Total finance receivables, net
increased during fiscal 2007 by
¥1,403.5 billion, or 16.9%, to ¥9,731.0
billion. The increase in finance
receivables resulted from the
increase in retail financings due to
the increase in vehicle unit sales, the
increase in wholesale, the increase in
other dealer loans including real
estate loans and working capital
financing provided to dealers, and
the increase in finance leases. As of March 31, 2007, finance
receivables were geographically distributed as follows: in North
America 64.5%, in Japan 13.1%, in Europe 10.2%, in Asia 3.6%
and in Other 8.6%. Toyota maintains programs to sell finance
400
1,200
800
1,600
0
Depreciation
* Excluding vehicles and equipment
on operating leases
Capital expenditures
(¥ Billion)
FY ’04’03 ’05 ’06 ’07
Capital Expenditures for
Property, Plant and Equip-
ment* and Depreciation*
1,000
3,000
2,000
4,000
0
Free cash flow
* (Net cash provided by operating
activities)
– (Capital expenditures for property,
plant and equipment, excluding
vehicles and equipment on
operating leases)
Net cash provided by
operating activities
(¥ Billion)
FY ’04’03 ’05 ’06 ’07
Net Cash Provided by
Operating Activities and
Free Cash Flow*
2,000
1,000
500
1,500
0
Cash and Cash Equivalents
at End of Year
(¥ Billion)
FY ’04’03 ’05 ’06 ’07
5,000
3,000
2,000
1,000
4,000
0
Liquid Assets*
(¥ Billion)
FY ’04’03 ’05 ’06 ’07
* Cash and cash equivalents, time
deposits, marketable debt
securities and investment in
monetary trust funds