Toyota 2007 Annual Report Download - page 108
Download and view the complete annual report
Please find page 108 of the 2007 Toyota annual report below. You can navigate through the pages in the report by either clicking on the pages listed below, or by using the keyword search tool below to find specific information within the annual report.-
 1
1 -
2
-
3
-
4
-
5
-
6
-
7
-
8
-
9
-
10
-
11
-
12
-
13
-
14
-
15
-
16
-
17
-
18
-
19
-
20
-
21
-
22
-
23
-
24
-
25
-
26
-
27
-
28
-
29
-
30
-
31
-
32
-
33
-
34
-
35
-
36
-
37
-
38
-
39
-
40
-
41
-
42
-
43
-
44
-
45
-
46
-
47
-
48
-
49
-
50
-
51
-
52
-
53
-
54
-
55
-
56
-
57
-
58
-
59
-
60
-
61
-
62
-
63
-
64
-
65
-
66
-
67
-
68
-
69
-
70
-
71
-
72
-
73
-
74
-
75
-
76
-
77
-
78
-
79
-
80
-
81
-
82
-
83
-
84
-
85
-
86
-
87
-
88
-
89
-
90
-
91
-
92
-
93
-
94
-
95
-
96
-
97
-
 98
98 -
 99
99 -
 100
100 -
 101
101 -
 102
102 -
 103
103 -
 104
104 -
 105
105 -
 106
106 -
 107
107 -
 108
108 -
 109
109 -
 110
110 -
 111
111 -
 112
112 -
 113
113 -
 114
114 -
 115
115 -
 116
116 -
 117
117 -
 118
118 -
119
-
120
-
121
-
122
-
123
-
124
-
125
-
126
-
127
-
128
-
129
-
130
-
131
-
132
-
133
-
134
-
135
-
136
-
137
-
138
-
139
-
140
 |
 |

106 ANNUAL REPORT 2007
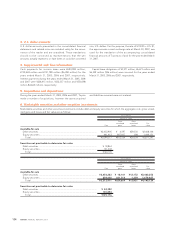
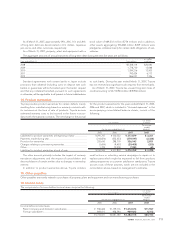
The following table summarizes certain cash flows received from and paid to the securitization trusts for the years ended March
31, 2005, 2006 and 2007.
U.S. dollars
Yen in millions in millions
For the years ended For the year ended
March 31, March 31,
2005 2006 2007 2007
Proceeds from new securitizations, net of purchased and
retained securities.............................................................................................. ¥ 48,958 ¥ 88,698 ¥69,018 $585
Servicing fees received........................................................................................ 3,762 2,297 1,881 16
Excess interest received from interest only strips ............................................. 9,140 4,219 2,818 24
Repurchases of receivables................................................................................. (34,675) (50,086) ——
Servicing advances............................................................................................... (215) (453) (234) (2)
Reimbursement of servicing and maturity advances ........................................ 860 793 234 2
Toyota maintains a program to sell retail and lease finance
receivables. Under the program, Toyota’s securitization transac-
tions are generally structured as qualifying SPEs (“QSPE”s), thus
Toyota achieves sale accounting treatment under the provisions
of FAS 140. Toyota recognizes a gain or loss on the sale of the
finance receivables upon the transfer of the receivables to the
securitization trusts structured as a QSPE. Toyota retains servic-
ing rights and earns a contractual servicing fee of 1% per
annum on the total monthly outstanding principal balance of
the related securitized receivables. In a subordinated capacity,
Toyota retains interest-only strips, subordinated securities, and
cash reserve funds in these securitizations, and these retained
interests are held as restricted assets subject to limited recourse
provisions and provide credit enhancement to the senior securi-
ties in Toyota’s securitization transactions. The retained interests
are not available to satisfy any obligations of Toyota. Investors
in the securitizations have no recourse to Toyota beyond the
contractual cash flows of the securitized receivables, retained
subordinated interests, any cash reserve funds and any amounts
available or funded under the revolving liquidity notes. Toyota’s
exposure to these retained interests exists until the associated
securities are paid in full. Investors do not have recourse to
other assets held by Toyota for failure of obligors on the receiv-
ables to pay when due or otherwise.
Toyota sold finance receivables under the program and rec-
ognized pretax gains resulting from these sales of ¥323 million,
¥837 million and ¥1,589 million ($13 million) for the years ended
March 31, 2005, 2006 and 2007, respectively, after providing an
allowance for estimated credit losses. The gain on sale record-
ed depends on the carrying amount of the assets at the time of
the sale. The carrying amount is allocated between the assets
sold and the retained interests based on their relative fair values
at the date of the sale. The key economic assumptions initially
and subsequently measuring the fair value of retained interests
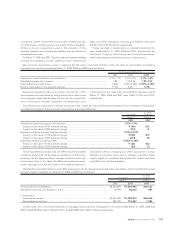
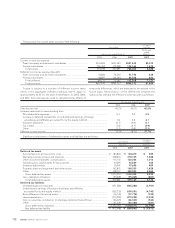
The contractual maturities of retail receivables, the future minimum lease payments on finance leases and wholesale and other
dealer loans at March 31, 2007 are summarized as follows:
Yen in millions U.S. dollars in millions
Wholesale Wholesale
Finance and other Finance and other
Years ending March 31, Retail lease dealer loans Retail lease dealer loans
2008................................................... ¥1,991,266 ¥198,701 ¥1,908,054 $16,868 $1,683 $16,163
2009................................................... 1,761,151 130,854 144,754 14,919 1,109 1,226
2010................................................... 1,438,970 115,295 97,027 12,189 977 822
2011................................................... 981,354 46,186 74,150 8,313 391 628
2012................................................... 511,974 19,794 69,235 4,337 168 587
Thereafter ......................................... 320,916 1,455 49,706 2,718 12 421
¥7,005,631 ¥512,285 ¥2,342,926 $59,344 $4,340 $19,847
Finance leases consist of the following:
U.S. dollars
Yen in millions in millions
March 31, March 31,
2006 2007 2007
Minimum lease payments ..................................................................................................... ¥ 472,725 ¥512,285 $4,340
Estimated unguaranteed residual values ............................................................................ 268,555 244,136 2,068
741,280 756,421 6,408
Deferred origination costs .................................................................................................... 1,462 1,335 11
Less—Unearned income ....................................................................................................... (102,241) (64,673) (548)
Less—Allowance for credit losses ........................................................................................ (6,140) (4,999) (42)
Finance leases, net ............................................................................................................ ¥ 634,361 ¥688,084 $5,829