Toyota 2007 Annual Report Download - page 6
Download and view the complete annual report
Please find page 6 of the 2007 Toyota annual report below. You can navigate through the pages in the report by either clicking on the pages listed below, or by using the keyword search tool below to find specific information within the annual report.-
 1
1 -
 2
2 -
 3
3 -
 4
4 -
 5
5 -
 6
6 -
 7
7 -
 8
8 -
 9
9 -
 10
10 -
 11
11 -
 12
12 -
 13
13 -
 14
14 -
 15
15 -
 16
16 -
 17
17 -
18
-
19
-
20
-
21
-
22
-
23
-
24
-
25
-
26
-
27
-
28
-
29
-
30
-
31
-
32
-
33
-
34
-
35
-
36
-
37
-
38
-
39
-
40
-
41
-
42
-
43
-
44
-
45
-
46
-
47
-
48
-
49
-
50
-
51
-
52
-
53
-
54
-
55
-
56
-
57
-
58
-
59
-
60
-
61
-
62
-
63
-
64
-
65
-
66
-
67
-
68
-
69
-
70
-
71
-
72
-
73
-
74
-
75
-
76
-
77
-
78
-
79
-
80
-
81
-
82
-
83
-
84
-
85
-
86
-
87
-
88
-
89
-
90
-
91
-
92
-
93
-
94
-
95
-
96
-
97
-
98
-
99
-
100
-
101
-
102
-
103
-
104
-
105
-
106
-
107
-
108
-
109
-
110
-
111
-
112
-
113
-
114
-
115
-
116
-
117
-
118
-
119
-
120
-
121
-
122
-
123
-
124
-
125
-
126
-
127
-
128
-
129
-
130
-
131
-
132
-
133
-
134
-
135
-
136
-
137
-
138
-
139
-
140
 |
 |

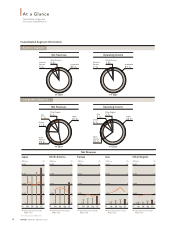
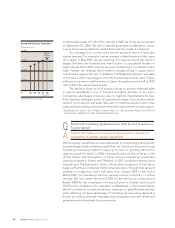
4ANNUAL REPORT 2007
At a Glance
Toyota Motor Corporation
Fiscal years ended March 31
Consolidated Segment Information
Business Segment
Net Revenues
FY 2007 FY 2007
Financial
Services
5.3%
Other Business
5.4%Automotive
89.3%
Operating Income
Financial
Services
7.1%
Other Business
1.8%Automotive
91.1%
Geographic Segment
Net Revenues
Europe
11.2%
Other Regions
6.1%Japan
47.0%
Asia
7.1%
North
America
28.6%
Europe
6.1%
Other Regions
3.7%Japan
64.9%
Asia
5.3%
North
America
20.0%
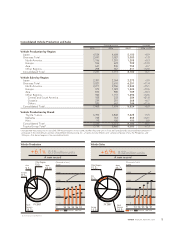
Operating Income
FY 2007 FY 2007
8,000
4,000
12,000
16,000
8
4
12
16
8,000
4,000
12,000
16,000
8
4
12
16
8,000
4,000
12,000
16,000
8
4
12
16
8,000
4,000
12,000
16,000
8
4
12
16
8,000
4,000
12,000
16,000
8
4
12
16
0000000000
Japan
(¥ Billion) (%)
FY ’04 ’05 ’06 ’07 FY ’04 ’05 ’06 ’07 FY ’04 ’05 ’06 ’07 FY ’04 ’05 ’06 ’07 FY ’04 ’05 ’06 ’07
Operating income margin
(Right scale)
North America
(¥ Billion) (%)
Operating income margin
(Right scale)
Europe
(¥ Billion) (%)
Operating income margin
(Right scale)
Asia
(¥ Billion) (%)
Operating income margin
(Right scale)
Other Regions
(¥ Billion) (%)
Operating income margin
(Right scale)
Net Revenues
Note: Fiscal years ended March 31