Toyota 2007 Annual Report Download - page 129
Download and view the complete annual report
Please find page 129 of the 2007 Toyota annual report below. You can navigate through the pages in the report by either clicking on the pages listed below, or by using the keyword search tool below to find specific information within the annual report.-
 1
1 -
2
-
3
-
4
-
5
-
6
-
7
-
8
-
9
-
10
-
11
-
12
-
13
-
14
-
15
-
16
-
17
-
18
-
19
-
20
-
21
-
22
-
23
-
24
-
25
-
26
-
27
-
28
-
29
-
30
-
31
-
32
-
33
-
34
-
35
-
36
-
37
-
38
-
39
-
40
-
41
-
42
-
43
-
44
-
45
-
46
-
47
-
48
-
49
-
50
-
51
-
52
-
53
-
54
-
55
-
56
-
57
-
58
-
59
-
60
-
61
-
62
-
63
-
64
-
65
-
66
-
67
-
68
-
69
-
70
-
71
-
72
-
73
-
74
-
75
-
76
-
77
-
78
-
79
-
80
-
81
-
82
-
83
-
84
-
85
-
86
-
87
-
88
-
89
-
90
-
91
-
92
-
93
-
94
-
95
-
96
-
97
-
98
-
99
-
100
-
101
-
102
-
103
-
104
-
105
-
106
-
107
-
108
-
109
-
110
-
111
-
112
-
113
-
114
-
115
-
116
-
117
-
118
-
 119
119 -
 120
120 -
 121
121 -
 122
122 -
 123
123 -
 124
124 -
 125
125 -
 126
126 -
 127
127 -
 128
128 -
 129
129 -
 130
130 -
 131
131 -
 132
132 -
 133
133 -
 134
134 -
 135
135 -
 136
136 -
 137
137 -
 138
138 -
 139
139 -
140
 |
 |

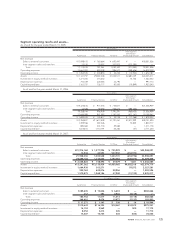
ANNUAL REPORT 2007 127
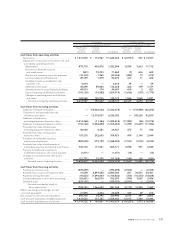
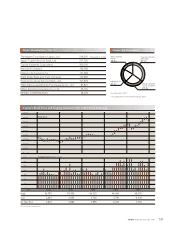
U.S. dollars
Yen in millions in millions
For the year
For the years ended March 31, ended March 31,
2005 2006 2007 2007
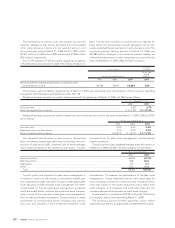
North America................................................................................................... ¥6,374,235 ¥7,687,738 ¥9,039,560 $76,574
Europe ............................................................................................................... 2,365,525 2,607,819 3,345,001 28,335
Asia .................................................................................................................... 1,776,554 2,005,777 2,248,031 19,043
Other.................................................................................................................. 2,089,2102,721,981 3,168,580 26,841
Revenues are attributed to geographies based on the coun-
try location of the parent company or the subsidiary that trans-
acted the sale with the external customer.
There are no any individually material countries with respect
to revenues, operating expenses, operating income, assets and
long-lived assets included in other foreign countries.
Unallocated amounts included in assets represent assets held
for corporate purposes, which mainly consist of cash and cash
equivalents and marketable securities. Such corporate assets
were ¥3,308,055 million, ¥4,231,148 million and ¥4,758,410 mil-
lion ($40,308 million), as of March 31, 2005, 2006 and 2007,
respectively.
Transfers between industries or geographic segments are
made at amounts which Toyota’s management believes
approximate arm’s-length transactions. In measuring the
reportable segments’ income or losses, operating income con-
sists of revenue less operating expenses.
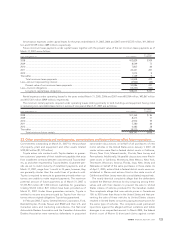
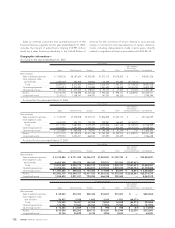
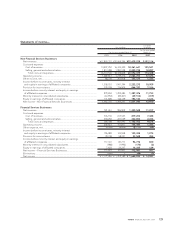
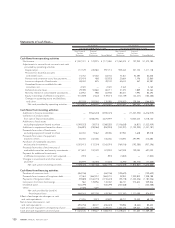
Certain financial statement data on non-financial services and financial services businesses—
The financial data below presents separately Toyota’s non-financial services and financial services businesses.
Balance sheets—
U.S. dollars
Yen in millions in millions
March 31, March 31,
2006 2007 2007
Non-Financial Services Businesses
Current assets
Cash and cash equivalents............................................................................................ ¥ 1,418,022 ¥ 1,714,722 $ 14,525
Marketable securities .................................................................................................... 633,036433,434 3,672
Trade accounts and notes receivable, less allowance for doubtful accounts .......... 2,002,577 2,044,729 17,321
Inventories...................................................................................................................... 1,620,975 1,803,956 15,281
Prepaid expenses and other current assets ................................................................ 1,480,043 1,617,554 13,702
Total current assets ................................................................................................... 7,154,6537,614,395 64,501
Investments and other assets ........................................................................................... 5,702,3766,464,204 54,758
Property, plant and equipment ........................................................................................ 5,207,760 5,689,383 48,195
Total Non-Financial Services Businesses assets ..................................................... 18,064,789 19,767,982 167,454
Financial Services Businesses
Current assets
Cash and cash equivalents............................................................................................ 151,365 185,657 1,573
Marketable securities .................................................................................................... 1,843 2,029 17
Finance receivables, net................................................................................................ 3,497,319 4,036,363 34,192
Prepaid expenses and other current assets ................................................................ 710,847 742,040 6,286
Total current assets ................................................................................................... 4,361,3744,966,089 42,068
Noncurrent finance receivables, net ................................................................................ 4,830,216 5,694,733 48,240
Investments and other assets ........................................................................................... 563,050 703,476 5,959
Property, plant and equipment ........................................................................................ 1,858,868 2,371,136 20,086
Total Financial Services Businesses assets .............................................................. 11,613,508 13,735,434 116,353
Eliminations........................................................................................................................ (946,702) (928,637) (7,866)
Total assets ................................................................................................................ ¥28,731,595 ¥32,574,779 $275,941
Assets in the non-financial services include unallocated corporate assets.
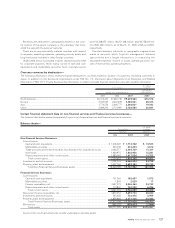
Overseas revenues by destination—
The following information shows revenues that are attributed to countries based on location of customers, excluding customers in
Japan. In addition to the disclosure requirements under FAS No. 131, Disclosure about Segments of an Enterprise and Related
Information (“FAS 131”), Toyota discloses this information in order to provide financial statement users with valuable information.