Toyota 2007 Annual Report Download - page 128
Download and view the complete annual report
Please find page 128 of the 2007 Toyota annual report below. You can navigate through the pages in the report by either clicking on the pages listed below, or by using the keyword search tool below to find specific information within the annual report.-
 1
1 -
2
-
3
-
4
-
5
-
6
-
7
-
8
-
9
-
10
-
11
-
12
-
13
-
14
-
15
-
16
-
17
-
18
-
19
-
20
-
21
-
22
-
23
-
24
-
25
-
26
-
27
-
28
-
29
-
30
-
31
-
32
-
33
-
34
-
35
-
36
-
37
-
38
-
39
-
40
-
41
-
42
-
43
-
44
-
45
-
46
-
47
-
48
-
49
-
50
-
51
-
52
-
53
-
54
-
55
-
56
-
57
-
58
-
59
-
60
-
61
-
62
-
63
-
64
-
65
-
66
-
67
-
68
-
69
-
70
-
71
-
72
-
73
-
74
-
75
-
76
-
77
-
78
-
79
-
80
-
81
-
82
-
83
-
84
-
85
-
86
-
87
-
88
-
89
-
90
-
91
-
92
-
93
-
94
-
95
-
96
-
97
-
98
-
99
-
100
-
101
-
102
-
103
-
104
-
105
-
106
-
107
-
108
-
109
-
110
-
111
-
112
-
113
-
114
-
115
-
116
-
117
-
 118
118 -
 119
119 -
 120
120 -
 121
121 -
 122
122 -
 123
123 -
 124
124 -
 125
125 -
 126
126 -
 127
127 -
 128
128 -
 129
129 -
 130
130 -
 131
131 -
 132
132 -
 133
133 -
 134
134 -
 135
135 -
 136
136 -
 137
137 -
 138
138 -
139
-
140
 |
 |

126 ANNUAL REPORT 2007
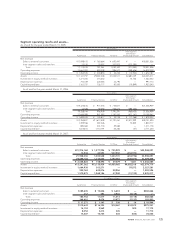
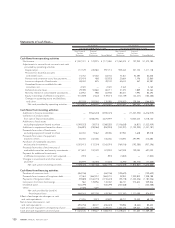
Sales to external customers and operating income of the
Financial Services segment for the year ended March 31, 2005,
includes the impact of adjustments totaling ¥14,991 million
made by a sales financing subsidiary in the United States of
America for the correction of errors relating to prior periods
mainly in connection with capitalization of certain disburse-
ments, including disbursements made in prior years, directly
related to origination of loans in accordance with FAS No. 91.
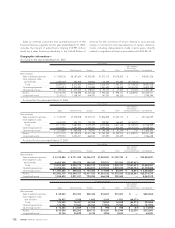
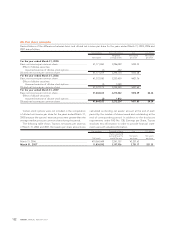
Geographic information—
As of and for the year ended March 31, 2005:
Yen in millions
Inter-segment
Elimination/
Japan North America Europe Asia Other Unallocated Amount Consolidated
Net revenues
Sales to external customers
..... ¥ 7,408,136 ¥6,187,624 ¥2,305,450 ¥1,572,113 ¥1,078,203 ¥ — ¥18,551,526
Inter-segment sales
and transfers ...................... 4,596,019 185,829 173,977 53,309 105,499 (5,114,633) —
Total ................................. 12,004,155 6,373,453 2,479,427 1,625,422 1,183,702 (5,114,633) 18,551,526
Operating expenses ........... 11,016,913 5,925,894 2,370,886 1,531,650 1,136,248 (5,102,252) 16,879,339
Operating income............... ¥ 987,242 ¥ 447,559 ¥ 108,541 ¥ 93,772 ¥ 47,454 ¥ (12,381) ¥ 1,672,187
Assets ................................... ¥10,740,796 ¥7,738,898 ¥2,242,566 ¥ 945,635 ¥ 998,172 ¥ 1,668,944 ¥24,335,011
Long-lived assets................. 3,110,123 1,708,147 544,597 247,507 185,220 — 5,795,594
As of and for the year ended March 31, 2006:
Yen in millions
Inter-segment
Elimination/
Japan North America Europe Asia Other Unallocated Amount Consolidated
Net revenues
Sales to external customers
..... ¥ 7,735,109 ¥7,455,818 ¥2,574,014 ¥1,836,855 ¥1,435,113 ¥ — ¥21,036,909
Inter-segment sales
and transfers ...................... 5,376,348 232,124 153,395 205,951 166,623 (6,134,441) —
Total ................................. 13,111,457 7,687,942 2,727,409 2,042,806 1,601,736 (6,134,441) 21,036,909
Operating expenses ........... 12,035,567 7,192,304 2,633,462 1,897,260 1,534,546 (6,134,572) 19,158,567
Operating income............... ¥ 1,075,890 ¥ 495,638 ¥ 93,947 ¥ 145,546 ¥ 67,190 ¥ 131 ¥ 1,878,342
Assets ................................... ¥12,177,125 ¥9,199,818 ¥2,471,258 ¥1,255,350 ¥1,299,072 ¥ 2,328,972 ¥28,731,595
Long-lived assets................. 3,395,553 2,403,211 666,543 347,892 253,429 — 7,066,628
As of and for the year ended March 31, 2007:
Yen in millions
Inter-segment
Elimination/
Japan North America Europe Asia Other Unallocated Amount Consolidated
Net revenues
Sales to external customers
..... ¥ 8,152,884 ¥ 8,771,495 ¥3,346,013 ¥1,969,957 ¥1,707,742 ¥ — ¥23,948,091
Inter-segment sales
and transfers ...................... 6,662,398 258,278 196,180 255,571 215,000 (7,587,427) —
Total ................................. 14,815,282 9,029,773 3,542,193 2,225,528 1,922,742 (7,587,427) 23,948,091
Operating expenses ........... 13,358,036 8,580,140 3,404,810 2,107,933 1,839,245 (7,580,756) 21,709,408
Operating income............... ¥ 1,457,246 ¥ 449,633 ¥ 137,383 ¥ 117,595 ¥ 83,497 ¥ (6,671) ¥ 2,238,683
Assets ................................... ¥12,992,379 ¥10,890,157 ¥2,917,183 ¥1,563,742 ¥1,575,255 ¥ 2,636,063 ¥32,574,779
Long-lived assets................. 3,558,695 2,931,037 794,984 466,338 309,465 — 8,060,519
U.S. dollars in millions
Inter-segment
Elimination/
Japan North America Europe Asia Other Unallocated Amount Consolidated
Net revenues
Sales to external customers
..... $ 69,063 $74,303 $28,344 $16,687 $14,467 $ — $202,864
Inter-segment sales
and transfers ..................... 56,437 2,188 1,662 2,165 1,821 (64,273) —
Total ................................. 125,500 76,491 30,006 18,852 16,288 (64,273) 202,864
Operating expenses ........... 113,156 72,682 28,842 17,856 15,580 (64,216) 183,900
Operating income............... $ 12,344 $ 3,809 $ 1,164 $ 996 $ 708 $ (57) $ 18,964
Assets ................................... $110,058 $92,250 $24,712 $13,247 $13,344 $ 22,330 $275,941
Long-lived assets................. 30,146 24,829 6,734 3,950 2,622 — 68,281