Toyota 2007 Annual Report Download - page 85
Download and view the complete annual report
Please find page 85 of the 2007 Toyota annual report below. You can navigate through the pages in the report by either clicking on the pages listed below, or by using the keyword search tool below to find specific information within the annual report.-
 1
1 -
2
-
3
-
4
-
5
-
6
-
7
-
8
-
9
-
10
-
11
-
12
-
13
-
14
-
15
-
16
-
17
-
18
-
19
-
20
-
21
-
22
-
23
-
24
-
25
-
26
-
27
-
28
-
29
-
30
-
31
-
32
-
33
-
34
-
35
-
36
-
37
-
38
-
39
-
40
-
41
-
42
-
43
-
44
-
45
-
46
-
47
-
48
-
49
-
50
-
51
-
52
-
53
-
54
-
55
-
56
-
57
-
58
-
59
-
60
-
61
-
62
-
63
-
64
-
65
-
66
-
67
-
68
-
69
-
70
-
71
-
72
-
73
-
74
-
 75
75 -
 76
76 -
 77
77 -
 78
78 -
 79
79 -
 80
80 -
 81
81 -
 82
82 -
 83
83 -
 84
84 -
 85
85 -
 86
86 -
 87
87 -
 88
88 -
 89
89 -
 90
90 -
 91
91 -
 92
92 -
 93
93 -
 94
94 -
 95
95 -
96
-
97
-
98
-
99
-
100
-
101
-
102
-
103
-
104
-
105
-
106
-
107
-
108
-
109
-
110
-
111
-
112
-
113
-
114
-
115
-
116
-
117
-
118
-
119
-
120
-
121
-
122
-
123
-
124
-
125
-
126
-
127
-
128
-
129
-
130
-
131
-
132
-
133
-
134
-
135
-
136
-
137
-
138
-
139
-
140
 |
 |

ANNUAL REPORT 2007 83
business operations and the impact of fluctuations in foreign cur-
rency translation rates. The increase for the financial services opera-
tions is primarily attributed to impact of increased expenses and
the impact of fluctuations in foreign currency translation rates.
Research and development expenses (included in cost of
products sales and selling, general and administrative expenses)
increased by ¥57.5 billion, or 7.6%, to ¥812.6 billion during fiscal
2006 compared with the prior year. This increase primarily relates
to expenditures attributed to the development of environmental-
ly conscious technologies including hybrid and fuel-cell technolo-
gy, aggressive developments in advanced technologies relating
to collision safety and vehicle stability controls and the impact of
expanding new models to promote Toyota’s strength in a global
market to further build up competitive strength in the future.
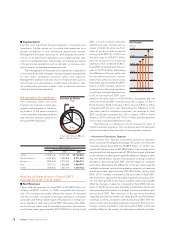
■Operating Income
Toyota’s operating income increased by ¥206.2 billion, or 12.3%,
to ¥1,878.3 billion during fiscal 2006 compared with the prior
year. Operating income was favorably affected by the vehicle unit
sales growth partially offset by changes in sales mix, the impact
of increased parts sales, continued cost reduction efforts,
improvements in all other operations and the favorable impact of
fluctuations in foreign currency translation rates. These increases
were partially offset by a reduction in the net gains on the trans-
fer to the government of the substitutional portion of certain
employee pension funds, increases in research and development
expenses, the impact of business expansion and the decreased
income in financial services operations. As a result, operating
income decreased to 8.9% as a percentage of net revenues for
fiscal 2006 compared to 9.0% in the prior year.
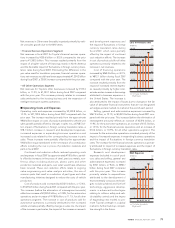
During fiscal 2006, operating income (before the elimination
of intersegment profits) by significant geographies resulted in
increases of ¥88.7 billion, or 9.0%, in Japan and ¥48.1 billion, or
10.7%, in North America, a decrease of ¥14.6 billion, or 13.4% in
Europe, an increase of ¥51.7 billion, or 55.2%, in Asia and ¥19.8
billion, or 41.6% in Other compared with the prior year. The
increase in Japan relates primarily to the vehicle unit sales growth
in the export markets partially offset by changes in sales mix, con-
tinued cost reduction efforts and the favorable impact of fluctua-
tions in foreign currency translation rates. The increase was
partially offset by the impact of a decrease in the net gains on the
transfer to the government of the substitutional portion of certain
employee pension funds and increases in research and develop-
ment expenses. The increase in North America relates primarily
to the increase in production volume and vehicle unit sales, the
impact of cost reduction efforts in the manufacturing operations
and the favorable impact of fluctuations in foreign currency trans-
lation rates. The decrease in the Europe relates mainly to increas-
es in expenses attributed to expansion of operations, despite of
the impact of cost reduction efforts in the manufacturing opera-
tions, an increase in production volume and vehicle unit sales
and the favorable impact of fluctuations in foreign currency trans-
lation rates. The increase in Asia relates primarily to the increase
in production volume and vehicle unit sales due to the IMV
series. The increase in Other relates primarily to the impact of the
increase in production volume and vehicle unit sales mainly
attributed to the IMV series.
The following is a discussion of operating income for each of
Toyota’s business segments. The operating income amounts dis-
cussed are before the elimination of intersegment profits.
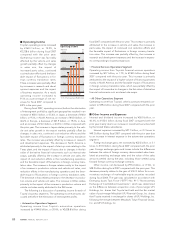
• Automotive Operations Segment
Operating income from Toyota’s automotive operations
increased by ¥241.5 billion, or 16.6%, to ¥1,694.0 billion during
fiscal 2006 compared with the prior year. This increase is primarily
attributed to the increase in vehicle unit sales, the increase in
parts sales, the impact of continued cost reduction efforts and the
favorable impact of fluctuations in foreign currency translation
rates. This increase was partially offset by a reduction in the net
gains on the transfer to the government of the substitutional por-
tion of certain employee pension funds, the increase in research
and development expenses and the increase in expenses corre-
sponding to business expansion.
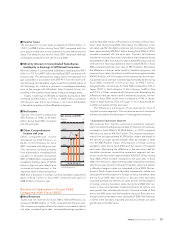
• Financial Services Operations Segment
Operating income from Toyota’s financial services operations
decreased by ¥45.0 billion, or 22.4%, to ¥155.8 billion during
fiscal 2006 compared with the prior year. This decrease was pri-
marily due to the impact of losses from changes in the fair value
of derivative financial instruments such as interest rate swaps and
the impact of adjustments made by a sales financing subsidiary in
fiscal 2005 for the correction of errors relating to prior periods
(see note 24 to the consolidated financial statements), despite of
the increase in the finance receivables asset base and the favor-
able impact of fluctuations in foreign currency translation rates.
• All Other Operations Segment
Operating income from Toyota’s other businesses increased by
¥6.0 billion, or 17.8%, to ¥39.7 billion during fiscal 2006 compared
with the prior year. This increase primarily relates to increased
production volume and sales attributed to the housing business
and the expansion of intelligent transport systems operations.
■Other Income and Expenses
Interest and dividend income increased by ¥26.5 billion, or
39.2%, to ¥94.0 billion during fiscal 2006 compared with the prior
year mainly due to an increase in investment securities held by
the United States subsidiaries.
Interest expense increased by ¥2.7 billion, or 14.0%, to ¥21.6
billion during fiscal 2006 compared with the prior year due to an
increase in borrowings in the automotive operations segment.
Foreign exchange gains, net decreased by ¥10.6 billion, or
49.6%, to ¥10.8 billion during fiscal 2006 compared with the prior
year. Foreign exchange gains and losses include the differences
between the value of foreign currency denominated sales trans-
lated at prevailing exchange rates and the value of the sales
amounts settled during the year, including those settled using
forward foreign currency exchange contracts.