Toyota 2007 Annual Report Download - page 109
Download and view the complete annual report
Please find page 109 of the 2007 Toyota annual report below. You can navigate through the pages in the report by either clicking on the pages listed below, or by using the keyword search tool below to find specific information within the annual report.-
 1
1 -
2
-
3
-
4
-
5
-
6
-
7
-
8
-
9
-
10
-
11
-
12
-
13
-
14
-
15
-
16
-
17
-
18
-
19
-
20
-
21
-
22
-
23
-
24
-
25
-
26
-
27
-
28
-
29
-
30
-
31
-
32
-
33
-
34
-
35
-
36
-
37
-
38
-
39
-
40
-
41
-
42
-
43
-
44
-
45
-
46
-
47
-
48
-
49
-
50
-
51
-
52
-
53
-
54
-
55
-
56
-
57
-
58
-
59
-
60
-
61
-
62
-
63
-
64
-
65
-
66
-
67
-
68
-
69
-
70
-
71
-
72
-
73
-
74
-
75
-
76
-
77
-
78
-
79
-
80
-
81
-
82
-
83
-
84
-
85
-
86
-
87
-
88
-
89
-
90
-
91
-
92
-
93
-
94
-
95
-
96
-
97
-
98
-
 99
99 -
 100
100 -
 101
101 -
 102
102 -
 103
103 -
 104
104 -
 105
105 -
 106
106 -
 107
107 -
 108
108 -
 109
109 -
 110
110 -
 111
111 -
 112
112 -
 113
113 -
 114
114 -
 115
115 -
 116
116 -
 117
117 -
 118
118 -
 119
119 -
120
-
121
-
122
-
123
-
124
-
125
-
126
-
127
-
128
-
129
-
130
-
131
-
132
-
133
-
134
-
135
-
136
-
137
-
138
-
139
-
140
 |
 |
ANNUAL REPORT 2007 107
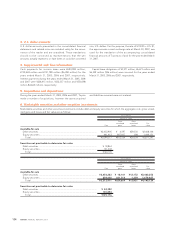
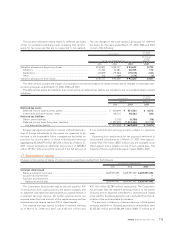
Key economic assumptions used in measuring the fair value of retained interests at the sale date of securitization transactions
completed during the years ended March 31, 2005, 2006 and 2007 were as follows:
For the years ended March 31,
2005 2006 2007
Prepayment speed related to securitizations...................................................................... 0.7%–1.1% 0.7%–1.4% 0.7%–1.4%
Weighted-average life (in years)........................................................................................... 1.85 1.72–2.06 1.90–2.57
Expected annual credit losses .............................................................................................. 0.30%0.05%–0.18% 0.05%–0.12%
Discount rate used on the retained interests...................................................................... 15.0% 5.0% 5.0%
Expected cumulative static pool losses over the life of the
securitizations are calculated by taking actual life to date losses
plus projected losses and dividing the sum by the original bal-
ance of each pool of assets. Expected cumulative static pool
credit losses for the retail loans securitized for the years ended
March 31, 2005, 2006 and 2007 were 0.40%, 0.19% and 0.16%,
respectively.
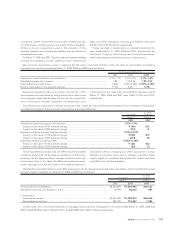
The key economic assumptions and the sensitivity of the current fair value of the retained interest to an immediate 10 and 20 per-
cent adverse change in those economic assumptions are presented below.
U.S. dollars
Yen in millions in millions
March 31, March 31,
2007 2007
Prepayment speed assumption (annual rate) ............................................................................................ 0.7%–1.5%
Impact on fair value of 10% adverse change ......................................................................................... ¥ (86) $(1)
Impact on fair value of 20% adverse change ......................................................................................... (173) (1)
Residual cash flows discount rate (annual rate) ......................................................................................... 5.0%–12.0%
Impact on fair value of 10% adverse change ......................................................................................... ¥(138) $(1)
Impact on fair value of 20% adverse change ......................................................................................... (274) (2)
Expected credit losses (annual rate)........................................................................................................... 0.05%–0.38%
Impact on fair value of 10% adverse change ......................................................................................... ¥ (26) $(0)
Impact on fair value of 20% adverse change ......................................................................................... (63) (1)
These hypothetical scenarios do not reflect expected market
conditions and should not be used as a prediction of future per-
formance. As the figures indicate, changes in the fair value may
not be linear. Also, in this table, the effect of a variation in a par-
ticular assumption on the fair value of the retained interest is
calculated without changing any other assumption. Actual
changes in one factor may result in changes in another, which
might magnify or counteract the sensitivities. Actual cash flows
may differ from the above analysis.
Outstanding receivable balances and delinquency amounts for managed retail and lease receivables, which include both owned
and securitized receivables, as of March 31, 2006 and 2007 are as follows:
U.S. dollars
Yen in millions in millions
March 31, March 31,
2006 2007 2007
Principal amount outstanding............................................................................................... ¥6,543,496 ¥7,569,490 $64,121
Delinquent amounts over 60 days or more ......................................................................... 32,799 58,662 497
Comprised of:
Receivables owned............................................................................................................ ¥6,337,306 ¥7,394,223 $62,636
Receivables securitized ..................................................................................................... 206,190 175,267 1,485
Credit losses, net of recoveries attributed to managed retail and lease receivables for the years ended March 31, 2005, 2006 and
2007 totaled ¥34,455 million, ¥46,427 million and ¥63,428 million ($537 million), respectively.
include the market interest rate environment, severity and rate
of credit losses, and the prepayment speed of the receivables.
All key economic assumptions used in the valuation of the
retained interests are reviewed periodically and are revised as
considered necessary.
At March 31, 2006 and 2007, Toyota’s retained interests relating
to these securitizations include interest in trusts, interest-only
strips, and other receivables, amounting to ¥18,316 million and
¥16,033 million ($136 million), respectively.
Toyota recorded no impairments on retained interests for the
years ended March 31, 2005, 2006 and 2007. Impairments are
calculated, if any, by discounting cash flows using manage-
ment’s estimates and other key economic assumptions.