Toyota 2007 Annual Report Download - page 17
Download and view the complete annual report
Please find page 17 of the 2007 Toyota annual report below. You can navigate through the pages in the report by either clicking on the pages listed below, or by using the keyword search tool below to find specific information within the annual report.-
 1
1 -
2
-
3
-
4
-
5
-
6
-
 7
7 -
 8
8 -
 9
9 -
 10
10 -
 11
11 -
 12
12 -
 13
13 -
 14
14 -
 15
15 -
 16
16 -
 17
17 -
 18
18 -
 19
19 -
 20
20 -
 21
21 -
 22
22 -
 23
23 -
 24
24 -
 25
25 -
 26
26 -
 27
27 -
28
-
29
-
30
-
31
-
32
-
33
-
34
-
35
-
36
-
37
-
38
-
39
-
40
-
41
-
42
-
43
-
44
-
45
-
46
-
47
-
48
-
49
-
50
-
51
-
52
-
53
-
54
-
55
-
56
-
57
-
58
-
59
-
60
-
61
-
62
-
63
-
64
-
65
-
66
-
67
-
68
-
69
-
70
-
71
-
72
-
73
-
74
-
75
-
76
-
77
-
78
-
79
-
80
-
81
-
82
-
83
-
84
-
85
-
86
-
87
-
88
-
89
-
90
-
91
-
92
-
93
-
94
-
95
-
96
-
97
-
98
-
99
-
100
-
101
-
102
-
103
-
104
-
105
-
106
-
107
-
108
-
109
-
110
-
111
-
112
-
113
-
114
-
115
-
116
-
117
-
118
-
119
-
120
-
121
-
122
-
123
-
124
-
125
-
126
-
127
-
128
-
129
-
130
-
131
-
132
-
133
-
134
-
135
-
136
-
137
-
138
-
139
-
140
 |
 |
ANNUAL REPORT 2007 15
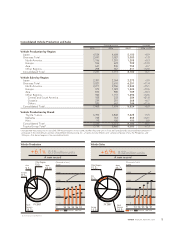
Performance Outlook
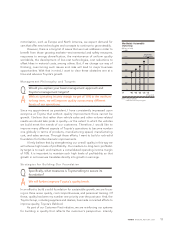
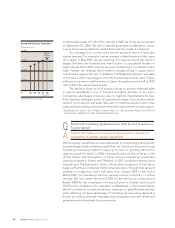
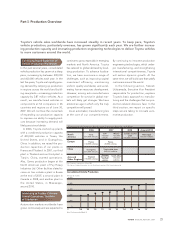
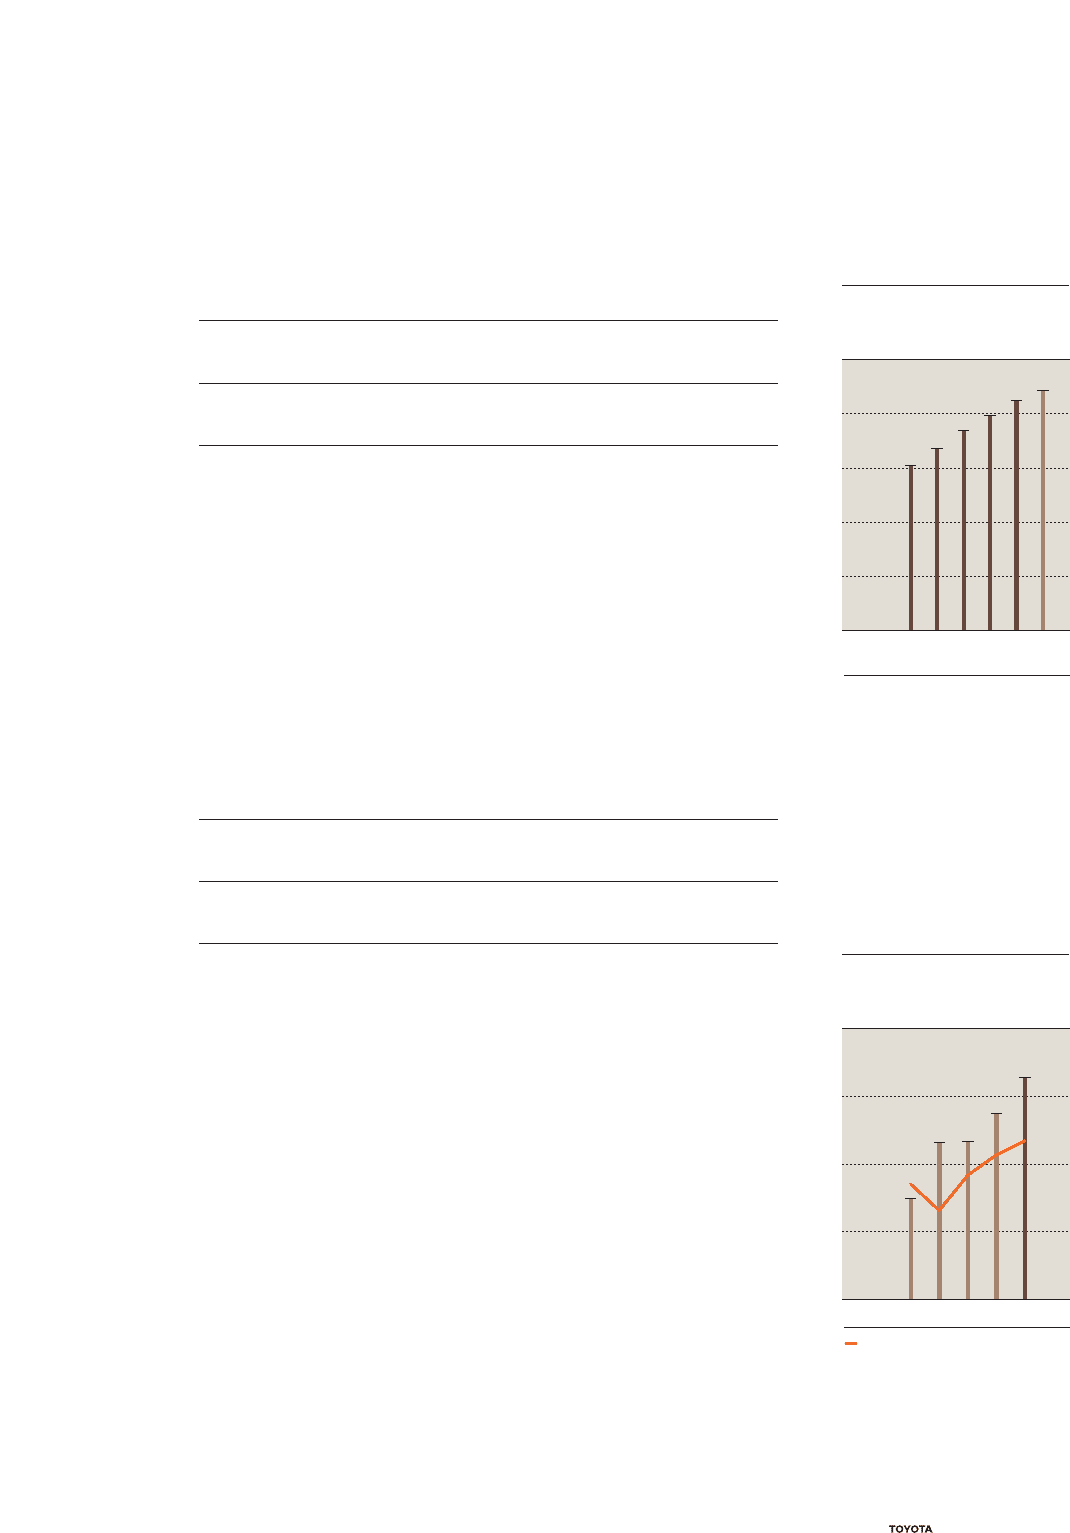
In the current fiscal year, ending March 31, 2008, we anticipate year-on-year
increases of 366,000 units in consolidated vehicle sales, to 8.89 million units;
4.4% in net revenues, to ¥25.00 trillion; 0.5% in operating income, to ¥2.25
trillion; and 0.4% in net income, to ¥1.65 trillion. (Please see Message from
the Executive Vice President Responsible for Accounting on page 16 for
information on performance outlook assumptions.)
We expect an increase in vehicle sales in regions across the world,
including in Asia, which saw vehicle sales decline in fiscal 2007. Given cur-
rency exchange rate fluctuations and material cost trends, business condi-
tions by no means warrant optimism. However, while investing for future
growth, we aim to achieve higher revenues and earnings again in the cur-
rent fiscal year.
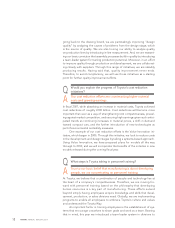
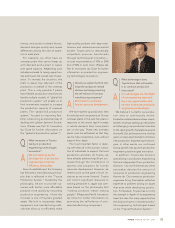
Policies for Returns to Shareholders and Capital Efficiency
Regarding returns to shareholders, in the past several years we have steadily
increased cash dividends each year in line with our improving performance.
Toyota’s consolidated dividend payout ratio target is 30% in the medium-
to-long term. In fiscal 2007, we paid a significantly higher annual dividend of
¥120.00 per share, up ¥30.00 per share from the previous fiscal year. As a
result, the consolidated payout ratio reached 23.4%.
In addition, the Company flexibly acquires shares of its own stock to
improve capital efficiency. During the Ordinary General Shareholders’
Meeting in June 2007, the Company received authorization to acquire up to
30 million shares of its own stock, for a maximum aggregate purchase price
of ¥250 billion.
The automotive industry is a growth industry, and expanding the oper-
ations of vehicle manufacturers requires a large amount of funding.
Therefore, we intend to step up investment to further increase earnings and
corporate value while consistently returning profits to shareholders.
Specifically, we will invest in advanced development that will further
improve product appeal and establish next-generation technologies. We
will also enlarge and augment our production and sales systems for the fur-
ther expansion of Toyota’s global operations.
I would like to ask our shareholders for their continued trust, support,
and understanding.
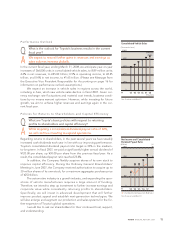
What is the outlook for Toyota’s business results in the current
fiscal year?
We expect to record further gains in revenues and earnings as
sales volumes increase globally.
Q
A
What are Toyota’s basic policies with respect to returning
profits to shareholders and capital efficiency?
While targeting a consolidated dividend payout ratio of 30%,
we will continue investing to expand operations.
Q
A
10,000
6,000
4,000
2,000
8,000
0
Consolidated Vehicle Sales
(Thousands of units)
FY
’04’03 ’05 ’06 ’07 ’08
(Projection)
Note: Fiscal years ended March 31
8.89 million
vehicles
2,000 40
1,000 20
500 10
1,500 30
00
Net Income and Consolidated
Dividend Payout Ratio
(%)
FY ’04’03 ’05 ’06 ’07
Consolidated dividend payout ratio (Right scale)
(¥ Billion)
Note: Fiscal years ended March 31