Toyota 2007 Annual Report Download - page 35
Download and view the complete annual report
Please find page 35 of the 2007 Toyota annual report below. You can navigate through the pages in the report by either clicking on the pages listed below, or by using the keyword search tool below to find specific information within the annual report.-
 1
1 -
2
-
3
-
4
-
5
-
6
-
7
-
8
-
9
-
10
-
11
-
12
-
13
-
14
-
15
-
16
-
17
-
18
-
19
-
20
-
21
-
22
-
23
-
24
-
 25
25 -
 26
26 -
 27
27 -
 28
28 -
 29
29 -
 30
30 -
 31
31 -
 32
32 -
 33
33 -
 34
34 -
 35
35 -
 36
36 -
 37
37 -
 38
38 -
 39
39 -
 40
40 -
 41
41 -
 42
42 -
 43
43 -
 44
44 -
 45
45 -
46
-
47
-
48
-
49
-
50
-
51
-
52
-
53
-
54
-
55
-
56
-
57
-
58
-
59
-
60
-
61
-
62
-
63
-
64
-
65
-
66
-
67
-
68
-
69
-
70
-
71
-
72
-
73
-
74
-
75
-
76
-
77
-
78
-
79
-
80
-
81
-
82
-
83
-
84
-
85
-
86
-
87
-
88
-
89
-
90
-
91
-
92
-
93
-
94
-
95
-
96
-
97
-
98
-
99
-
100
-
101
-
102
-
103
-
104
-
105
-
106
-
107
-
108
-
109
-
110
-
111
-
112
-
113
-
114
-
115
-
116
-
117
-
118
-
119
-
120
-
121
-
122
-
123
-
124
-
125
-
126
-
127
-
128
-
129
-
130
-
131
-
132
-
133
-
134
-
135
-
136
-
137
-
138
-
139
-
140
 |
 |
ANNUAL REPORT 2007 33
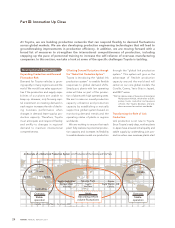
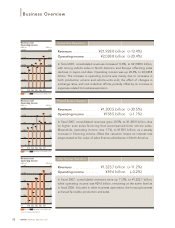
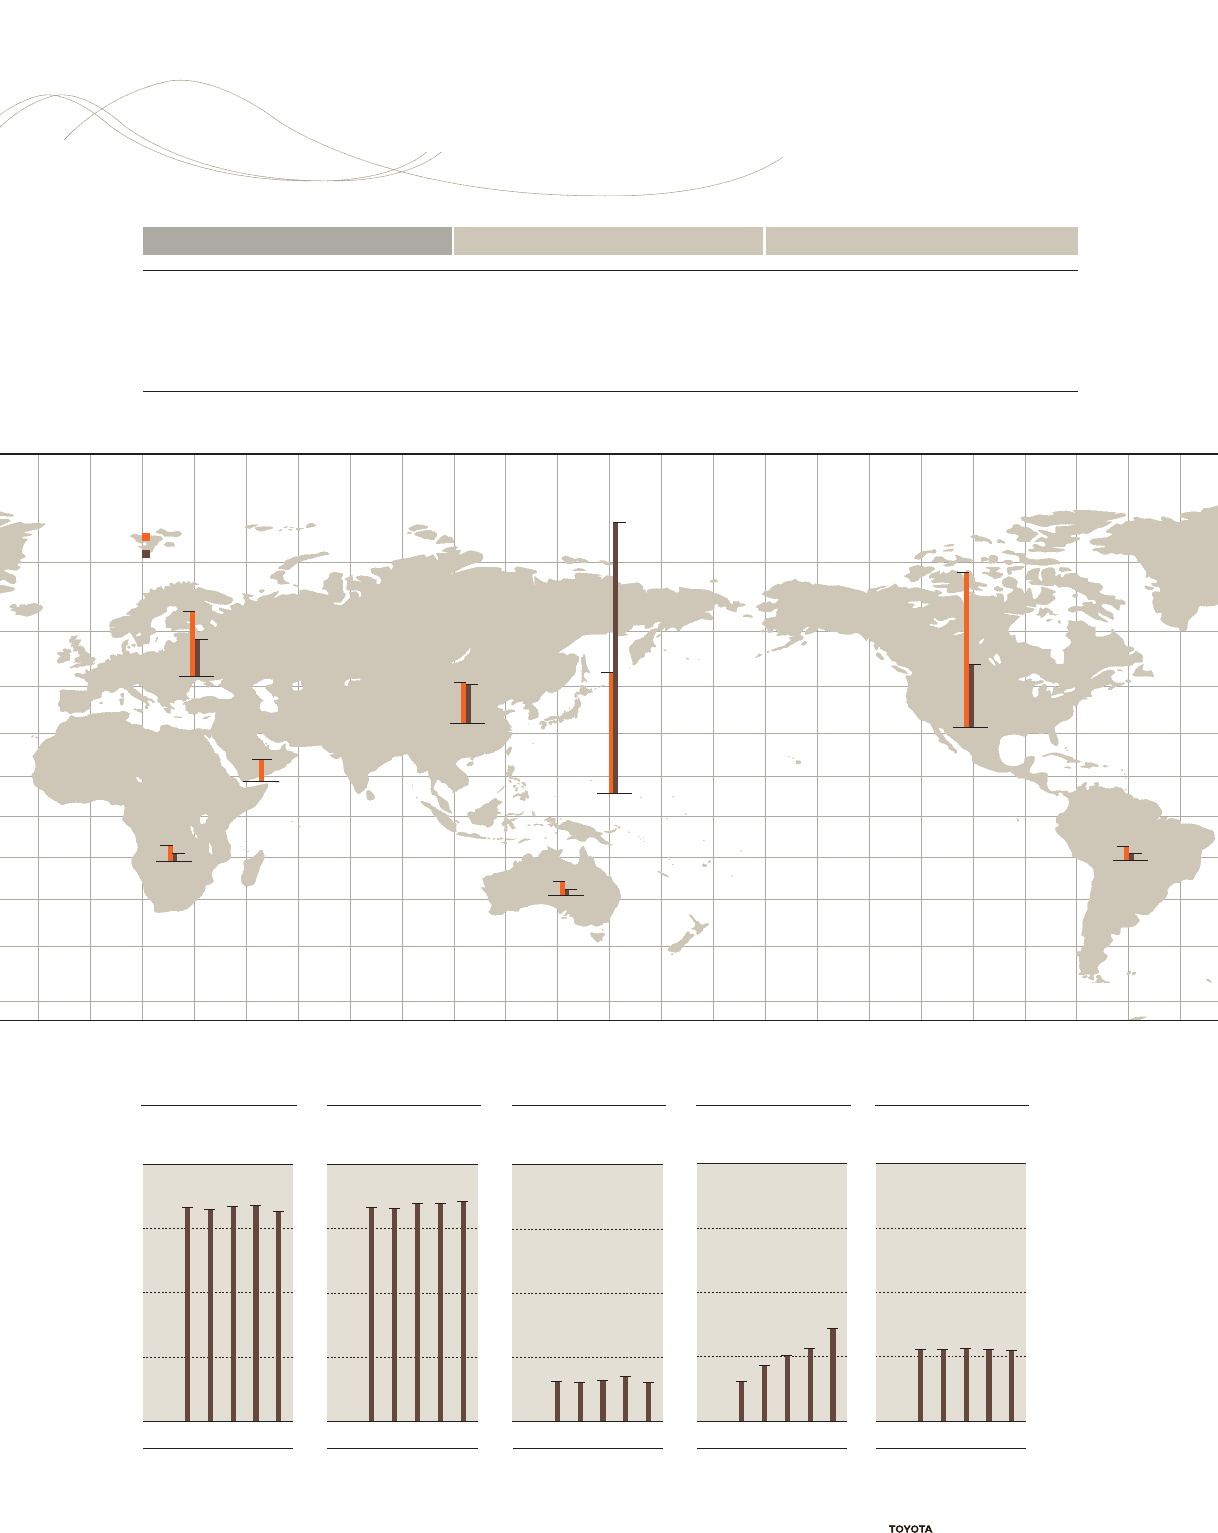
Consolidated Vehicle Sales (Thousands of units)
Consolidated Production (Thousands of units)
(FY 2007)
Consolidated Vehicle Sales and Production
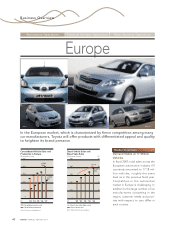
Europe
Oceania
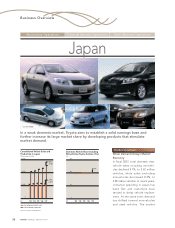
Japan
+8.9%
5,100
–3.9%
2,273
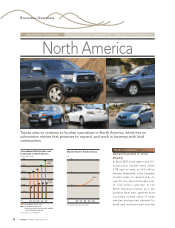
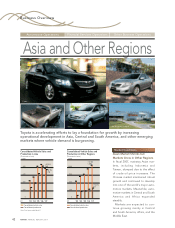
Asia North America
Central and
South America
Africa
Middle East
–9.7%
755
–10.3%
789
+6.8%
433
+13.9%
709
+19.6%
1,224
+11.1%
147
+20.0%
304
+3.9%
117
+6.7%
268
+0.3%
1,205
+15.1%
2,942
+20.6%
147
+21.8%
284
10,000
5,000
15,000
20,000
10,000
5,000
15,000
20,000
10,000
5,000
15,000
20,000
10,000
5,000
15,000
20,000
10,000
5,000
15,000
20,000
00000
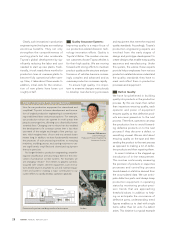
U.S.
Automotive Market (Sales)
(Thousands of units)
CY ’03’02 ’04 ’05 ’06
Europe
CY ’03’02 ’04 ’05 ’06
Asia
CY ’03’02 ’04 ’05 ’06
China
CY ’03’02 ’04 ’05 ’06
Japan
(Thousands of units)(Thousands of units)(Thousands of units)(Thousands of units)
CY ’03’02 ’04 ’05 ’06
Source: Toyota Motor Corporation Note: market definitions—Europe: Germany, France, the United Kingdom, Italy, Spain, the Netherlands, Belgium, Portugal, Denmark,
Greece, Ireland, Sweden, Austria, Finland, Switzerland, Norway, Poland, Hungary, and the Czech Republic; Asia: Indonesia, Thailand, the Philippines, Malaysia, Singapore,
Vietnam, Taiwan, and South Korea; Japan: minivehicles included.
Market Summary
Principal Market Data
Automotive Operations Financial Services Operations Other Business Operations
Business Overview