Toyota 2007 Annual Report Download - page 127
Download and view the complete annual report
Please find page 127 of the 2007 Toyota annual report below. You can navigate through the pages in the report by either clicking on the pages listed below, or by using the keyword search tool below to find specific information within the annual report.-
 1
1 -
2
-
3
-
4
-
5
-
6
-
7
-
8
-
9
-
10
-
11
-
12
-
13
-
14
-
15
-
16
-
17
-
18
-
19
-
20
-
21
-
22
-
23
-
24
-
25
-
26
-
27
-
28
-
29
-
30
-
31
-
32
-
33
-
34
-
35
-
36
-
37
-
38
-
39
-
40
-
41
-
42
-
43
-
44
-
45
-
46
-
47
-
48
-
49
-
50
-
51
-
52
-
53
-
54
-
55
-
56
-
57
-
58
-
59
-
60
-
61
-
62
-
63
-
64
-
65
-
66
-
67
-
68
-
69
-
70
-
71
-
72
-
73
-
74
-
75
-
76
-
77
-
78
-
79
-
80
-
81
-
82
-
83
-
84
-
85
-
86
-
87
-
88
-
89
-
90
-
91
-
92
-
93
-
94
-
95
-
96
-
97
-
98
-
99
-
100
-
101
-
102
-
103
-
104
-
105
-
106
-
107
-
108
-
109
-
110
-
111
-
112
-
113
-
114
-
115
-
116
-
 117
117 -
 118
118 -
 119
119 -
 120
120 -
 121
121 -
 122
122 -
 123
123 -
 124
124 -
 125
125 -
 126
126 -
 127
127 -
 128
128 -
 129
129 -
 130
130 -
 131
131 -
 132
132 -
 133
133 -
 134
134 -
 135
135 -
 136
136 -
 137
137 -
138
-
139
-
140
 |
 |
ANNUAL REPORT 2007 125
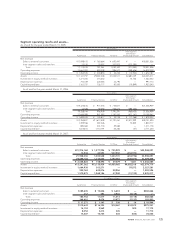
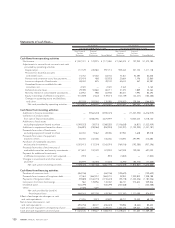
Segment operating results and assets—
As of and for the year ended March 31, 2005:
Yen in millions
Inter-segment
Elimination/
Automotive Financial Services All Other Unallocated Amount Consolidated
Net revenues
Sales to external customers ........................................ ¥17,098,415 ¥ 760,664 ¥ 692,447 ¥ — ¥18,551,526
Inter-segment sales and transfers .............................. 15,120 20,597 337,873 (373,590) —
Total.......................................................................... 17,113,535 781,261 1,030,320 (373,590) 18,551,526
Operating expenses ........................................................ 15,661,000 580,408 996,577 (358,646) 16,879,339
Operating income............................................................ ¥ 1,452,535 ¥ 200,853 ¥ 33,743 ¥ (14,944) ¥ 1,672,187
Assets .............................................................................. ¥11,141,197 ¥9,487,248 ¥1,025,517 ¥2,681,049 ¥24,335,011
Investment in equity method investees ......................... 1,271,044 215,642 — 75,746 1,562,432
Depreciation expenses.................................................... 754,339 220,584 22,790 — 997,713
Capital expenditure ......................................................... 1,161,757 726,777 50,555 (15,849) 1,923,240
As of and for the year ended March 31, 2006:
Yen in millions
Inter-segment
Elimination/
Automotive Financial Services All Other Unallocated Amount Consolidated
Net revenues
Sales to external customers ........................................ ¥19,325,616 ¥ 977,416 ¥ 733,877 ¥ — ¥21,036,909
Inter-segment sales and transfers .............................. 12,528 19,493 456,414 (488,435) —
Total.......................................................................... 19,338,144 996,909 1,190,291 (488,435) 21,036,909
Operating expenses ........................................................ 17,644,099 841,092 1,150,543 (477,167) 19,158,567
Operating income............................................................ ¥ 1,694,045 ¥ 155,817 ¥ 39,748 ¥ (11,268) ¥ 1,878,342
Assets .............................................................................. ¥12,354,827 ¥11,613,508 ¥1,191,261 ¥3,571,999 ¥28,731,595
Investment in equity method investees ......................... 1,459,556 287,326 — 73,835 1,820,717
Depreciation expenses.................................................... 880,360 301,734 29,084 — 1,211,178
Capital expenditure ......................................................... 1,615,814 1,110,191 45,282 (47) 2,771,240
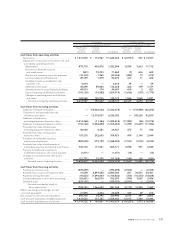
As of and for the year ended March 31, 2007:
Yen in millions
Inter-segment
Elimination/
Automotive Financial Services All Other Unallocated Amount Consolidated
Net revenues
Sales to external customers ........................................ ¥21,914,168 ¥ 1,277,994 ¥ 755,929 ¥ — ¥23,948,091
Inter-segment sales and transfers .............................. 13,838 22,554 567,802 (604,194) —
Total.......................................................................... 21,928,006 1,300,548 1,323,731 (604,194) 23,948,091
Operating expenses ........................................................ 19,889,178 1,142,053 1,284,052 (605,875) 21,709,408
Operating income............................................................ ¥ 2,038,828 ¥ 158,495 ¥ 39,679 ¥ 1,681 ¥ 2,238,683
Assets .............................................................................. ¥13,297,362 ¥13,735,434 ¥1,459,965 ¥4,082,018 ¥32,574,779
Investment in equity method investees ......................... 1,664,938 303,271 — 59,072 2,027,281
Depreciation expenses.................................................... 950,762 402,876 28,956 — 1,382,594
Capital expenditure ......................................................... 1,570,875 1,268,186 47,948 (51,192) 2,835,817
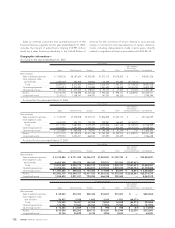
U.S. dollars in millions
Inter-segment
Elimination/
Automotive Financial Services All Other Unallocated Amount Consolidated
Net revenues
Sales to external customers ........................................ $185,635 $ 10,826 $ 6,403 $ — $202,864
Inter-segment sales and transfers .............................. 117 191 4,810 (5,118) —
Total.......................................................................... 185,752 11,017 11,213 (5,118) 202,864
Operating expenses ........................................................ 168,481 9,674 10,877 (5,132) 183,900
Operating income............................................................ $ 17,271 $ 1,343 $ 336 $ 14 $ 18,964
Assets .............................................................................. $112,642 $116,353 $12,367 $34,579 $275,941
Investment in equity method investees ......................... 14,104 2,569 — 500 17,173
Depreciation expenses.................................................... 8,054 3,413 245 — 11,712
Capital expenditure ......................................................... 13,307 10,743 406 (434) 24,022