Toyota 2007 Annual Report Download - page 83
Download and view the complete annual report
Please find page 83 of the 2007 Toyota annual report below. You can navigate through the pages in the report by either clicking on the pages listed below, or by using the keyword search tool below to find specific information within the annual report.-
 1
1 -
2
-
3
-
4
-
5
-
6
-
7
-
8
-
9
-
10
-
11
-
12
-
13
-
14
-
15
-
16
-
17
-
18
-
19
-
20
-
21
-
22
-
23
-
24
-
25
-
26
-
27
-
28
-
29
-
30
-
31
-
32
-
33
-
34
-
35
-
36
-
37
-
38
-
39
-
40
-
41
-
42
-
43
-
44
-
45
-
46
-
47
-
48
-
49
-
50
-
51
-
52
-
53
-
54
-
55
-
56
-
57
-
58
-
59
-
60
-
61
-
62
-
63
-
64
-
65
-
66
-
67
-
68
-
69
-
70
-
71
-
72
-
 73
73 -
 74
74 -
 75
75 -
 76
76 -
 77
77 -
 78
78 -
 79
79 -
 80
80 -
 81
81 -
 82
82 -
 83
83 -
 84
84 -
 85
85 -
 86
86 -
 87
87 -
 88
88 -
 89
89 -
 90
90 -
 91
91 -
 92
92 -
 93
93 -
94
-
95
-
96
-
97
-
98
-
99
-
100
-
101
-
102
-
103
-
104
-
105
-
106
-
107
-
108
-
109
-
110
-
111
-
112
-
113
-
114
-
115
-
116
-
117
-
118
-
119
-
120
-
121
-
122
-
123
-
124
-
125
-
126
-
127
-
128
-
129
-
130
-
131
-
132
-
133
-
134
-
135
-
136
-
137
-
138
-
139
-
140
 |
 |
ANNUAL REPORT 2007 81
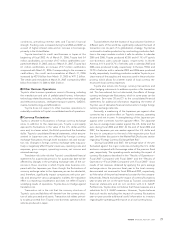
■Income Taxes
The provision for income taxes increased by ¥103.2 billion, or
13.0%, to ¥898.3 billion during fiscal 2007 compared with the
prior year primarily due to the increase in income before income
taxes. The effective tax rate for fiscal 2007 remained relatively
unchanged compared to the rate for fiscal 2006.
■Minority Interest in Consolidated Subsidiaries
and Equity in Earnings of Affiliated Companies
Minority interest in consolidated subsidiaries decreased by ¥34.7
billion, or 41.1%, to ¥49.7 billion during fiscal 2007 compared with
the prior year. This decrease was mainly due to the decrease of a
gain calculated in accordance with EITF 91-5 from the nonmone-
tary exchange of marketable equity investments related shares of
UFJ Holdings, Inc. held by a domestic consolidated subsidiary
prior to the merger with Mitsubishi Tokyo Financial Group, Inc.
resulting in the receipt of new shares in the post-merger entity.
Equity in earnings of affiliated companies during fiscal 2007
increased by ¥45.2 billion, or 27.5%, to ¥209.5 billion compared
with the prior year due to an increase in net income attributable
to favorable operations at the affiliated companies.
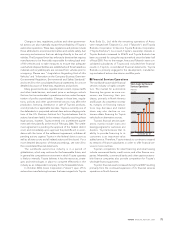
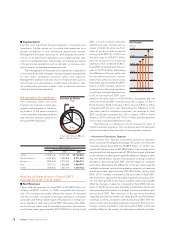
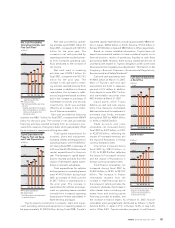
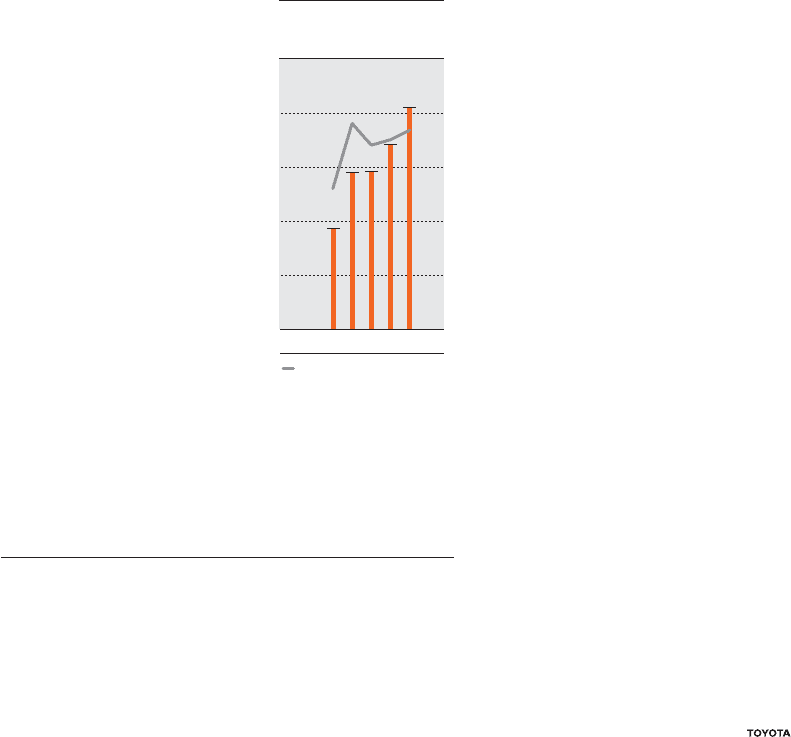
■Net Income
Toyota’s net income increased by
¥271.9 billion, or 19.8%, to ¥1,644.0
billion during fiscal 2007 compared
with the prior year.
■Other Comprehensive
Income and Loss
Other comprehensive income
decreased by ¥344.9 billion, or
66.6%, to ¥173.0 billion for fiscal
2007 compared with the prior year.
This decrease resulted primarily
from a decrease in unrealized hold-
ing gains on securities during fiscal
2007 of ¥38.8 billion compared with
unrealized holding gains of ¥244.6
billion in the prior year reflecting an
incremental improvement in the
Japanese stock market during fiscal
2006 and a decrease in foreign currency translation adjustment
gains of ¥130.7 billion in fiscal 2007 compared with gains of
¥268.4 billion in the prior year.
Results of Operations—Fiscal 2006
Compared with Fiscal 2005
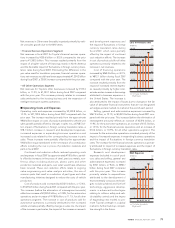
■Net Revenues
Toyota had net revenues for fiscal 2006 of ¥21,036.9 billion, an
increase of ¥2,485.4 billion, or 13.4%, compared with the prior year.
This increase principally reflects the impact of increased vehicle
unit sales, increased parts sales, increased financings operations
and the favorable impact of fluctuations in foreign currency trans-
lation rates during fiscal 2006. Eliminating the difference in the
yen value used for translation purposes, net revenues would have
been approximately ¥20,405.1 billion during fiscal 2006, a 10.0%
increase compared with the prior year. Toyota’s net revenues
include net revenues from sales of products that increased during
fiscal 2006 by 12.8% from the prior year to ¥20,059.5 billion and net
revenues from financing operations that increased 28.5% in fiscal
2006 compared with the prior year to ¥977.4 billion. Eliminating
the difference in the yen value used for translation purposes, net
revenues from sales of products would have been approximately
¥19,472.4 billion, a 9.5% increase, while net revenues from financ-
ing operations would have increased approximately 22.6% during
fiscal 2006 compared to the prior year to ¥932.7 billion.
Geographically, net revenues for fiscal 2006 increased by 4.4% in
Japan, 20.5% in North America, 11.6% in Europe, 16.8% in Asia
and 33.1% in Other compared with the prior year. Eliminating the
difference in the yen value used for translation purposes, net rev-
enues in fiscal 2006 would have increased by 4.4% in Japan,
14.2% in North America, 9.2% in Europe, 11.1% in Asia and 24.4%
in Other compared with the prior year.
The following is a discussion of net revenues for each of
Toyota’s business segments. The net revenue amounts discussed
are amounts before the elimination of intersegment revenues.
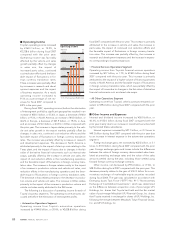
• Automotive Operations Segment
Net revenues from Toyota’s automotive operations segment,
which constitute the largest percentage of Toyota’s net revenues,
increased in fiscal 2006 by ¥2,224.6 billion, or 13.0% compared
with the prior year to ¥19,338.1 billion. The increase resulted pri-
marily from the approximate ¥1,200 billion impact attributed to
the vehicle unit sales growth partially offset by changes in sales
mix, the ¥585.9 billion impact of fluctuations in foreign currency
translation rates during fiscal 2006, and the impact of increased
parts sales. Eliminating the difference in the yen value used for
translation purposes, automotive operations segment net rev-
enues would have been approximately ¥18,752.2 billion during
fiscal 2006, a 9.6% increase compared to the prior year. In fiscal
2006, net revenues in Japan were favorably impacted primarily by
vehicle unit sales growth in the export markets, which was partial-
ly offset by changes in sales mix compared to fiscal 2005. Net rev-
enues in North America were favorably impacted by vehicle unit
sales growth and fluctuations in foreign currency translation rates
during fiscal 2006. Net revenues in Europe were favorably
impacted primarily by vehicle unit sales growth and fluctuations
in foreign currency translation rates during fiscal 2006. Net rev-
enues in Asia were favorably impacted primarily by vehicle unit
sales growth that includes sales both to Asia and outside of Asia
due to the IMV series and the favorable impact of fluctuations in
foreign currency translation rates during fiscal 2006. Net revenues
in Other were favorably impacted primarily by vehicle unit sales
growth due to the IMV series.
2,000 20
1,200 12
800 8
400 4
1,600 16
00
Net Income and ROE
(¥ Billion) (%)
FY ’04’03 ’05 ’06 ’07
ROE (Right scale)