Toyota 2007 Annual Report Download - page 40
Download and view the complete annual report
Please find page 40 of the 2007 Toyota annual report below. You can navigate through the pages in the report by either clicking on the pages listed below, or by using the keyword search tool below to find specific information within the annual report.-
 1
1 -
2
-
3
-
4
-
5
-
6
-
7
-
8
-
9
-
10
-
11
-
12
-
13
-
14
-
15
-
16
-
17
-
18
-
19
-
20
-
21
-
22
-
23
-
24
-
25
-
26
-
27
-
28
-
29
-
 30
30 -
 31
31 -
 32
32 -
 33
33 -
 34
34 -
 35
35 -
 36
36 -
 37
37 -
 38
38 -
 39
39 -
 40
40 -
 41
41 -
 42
42 -
 43
43 -
 44
44 -
 45
45 -
 46
46 -
 47
47 -
 48
48 -
 49
49 -
 50
50 -
51
-
52
-
53
-
54
-
55
-
56
-
57
-
58
-
59
-
60
-
61
-
62
-
63
-
64
-
65
-
66
-
67
-
68
-
69
-
70
-
71
-
72
-
73
-
74
-
75
-
76
-
77
-
78
-
79
-
80
-
81
-
82
-
83
-
84
-
85
-
86
-
87
-
88
-
89
-
90
-
91
-
92
-
93
-
94
-
95
-
96
-
97
-
98
-
99
-
100
-
101
-
102
-
103
-
104
-
105
-
106
-
107
-
108
-
109
-
110
-
111
-
112
-
113
-
114
-
115
-
116
-
117
-
118
-
119
-
120
-
121
-
122
-
123
-
124
-
125
-
126
-
127
-
128
-
129
-
130
-
131
-
132
-
133
-
134
-
135
-
136
-
137
-
138
-
139
-
140
 |
 |
38 ANNUAL REPORT 2007
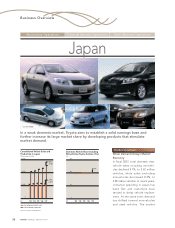
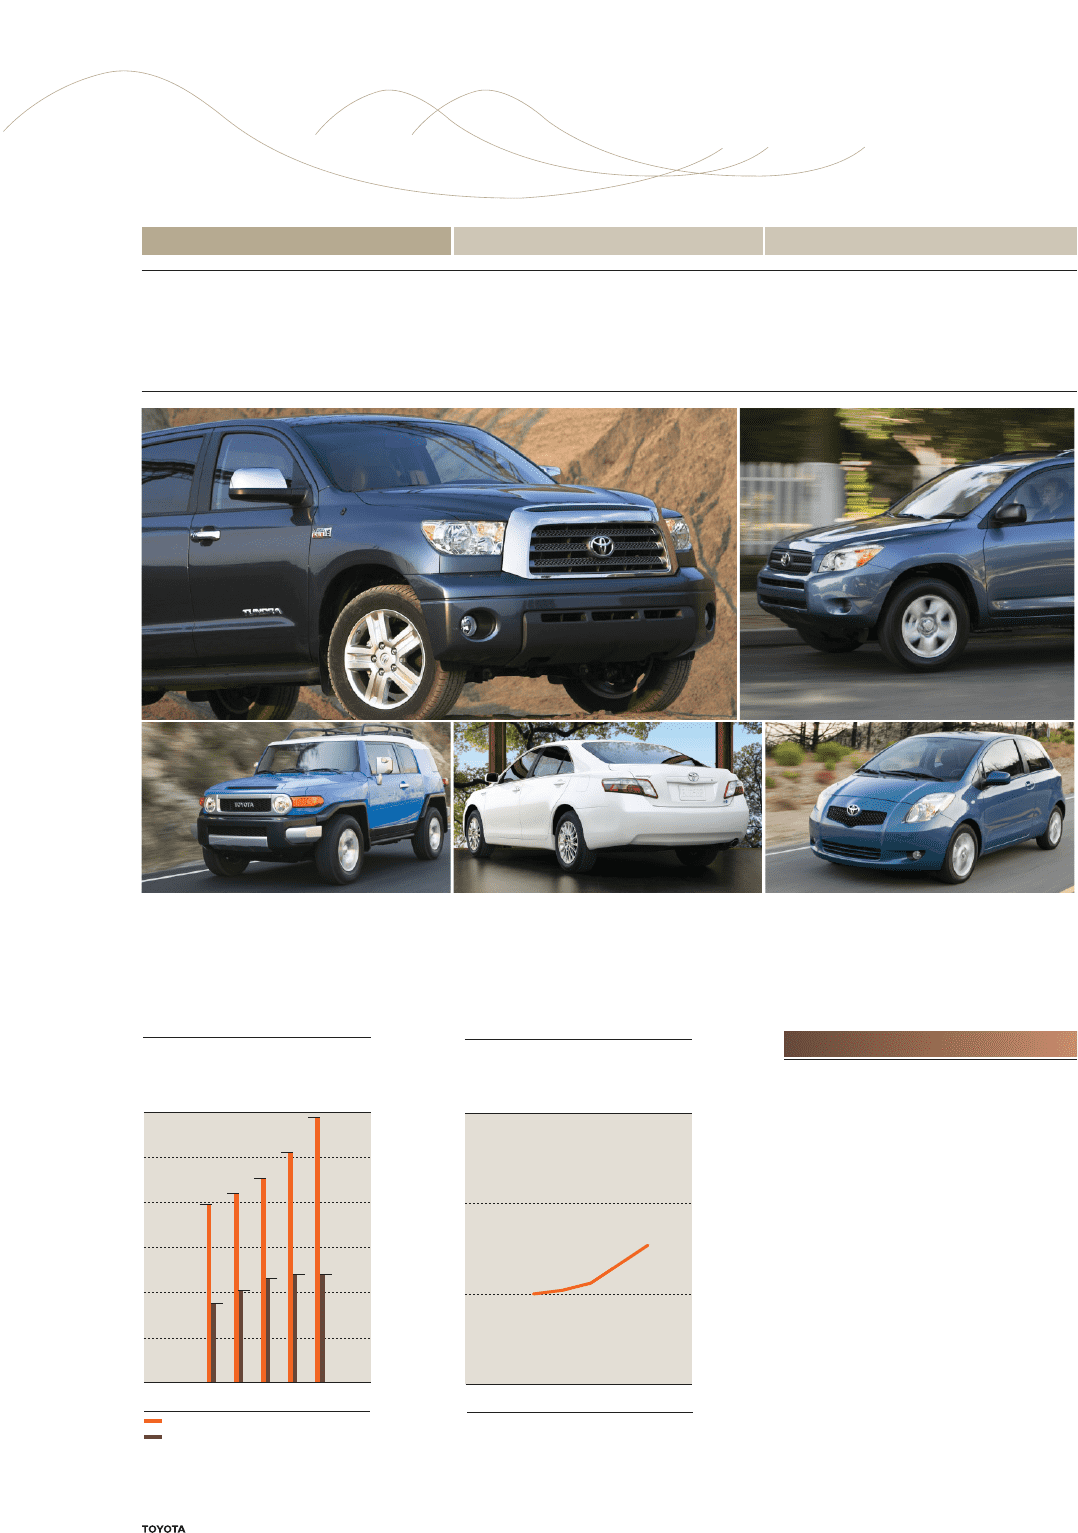
North America
Toyota aims to continue to localize operations in North America, which has an
automotive market that promises to expand, and work in harmony with local
communities.
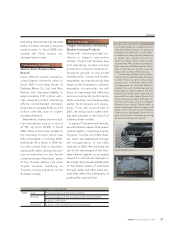
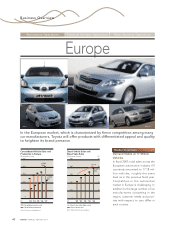
Market Conditions
Demand Expected to Grow
Steadily
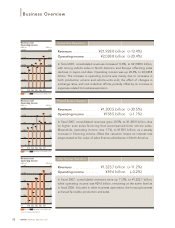
In fiscal 2007, total sales in the U.S.
automotive market were down
3.1% year on year, to 16.5 million
vehicles. Meanwhile, in the Canadian
market sales increased year on
year for the second straight year,
to 1.62 million vehicles. In the
North American market, as in the
previous fiscal year, gasoline price
increases curbed sales of large
vehicles and spurred demand for
small and medium-sized vehicles
30
10
20
0
’03’02 ’04 ’05 ’06
15.4%
Note: Different from fiscal year figures
Market Share in North America
(%)
CY
1,500
1,000
500
2,500
2,000
3,000
0
’03 ’04 ’05 ’06 ’07
+15.1%
2,942
+0.3%
1,205
Consolidated Vehicle Sales and
Production in North America
(Thousands of units)
FY
Consolidated vehicle sales
Consolidated production*
* Excluding vehicles produced by NUMMI
(unconsolidated company)
Note: Fiscal years ended March 31
Tundra RAV4
FJ Cruiser Camry Hybrid Yaris
Automotive Operations Financial Services Operations Other Business Operations
Business Overview