Toyota 2007 Annual Report Download - page 82
Download and view the complete annual report
Please find page 82 of the 2007 Toyota annual report below. You can navigate through the pages in the report by either clicking on the pages listed below, or by using the keyword search tool below to find specific information within the annual report.-
 1
1 -
2
-
3
-
4
-
5
-
6
-
7
-
8
-
9
-
10
-
11
-
12
-
13
-
14
-
15
-
16
-
17
-
18
-
19
-
20
-
21
-
22
-
23
-
24
-
25
-
26
-
27
-
28
-
29
-
30
-
31
-
32
-
33
-
34
-
35
-
36
-
37
-
38
-
39
-
40
-
41
-
42
-
43
-
44
-
45
-
46
-
47
-
48
-
49
-
50
-
51
-
52
-
53
-
54
-
55
-
56
-
57
-
58
-
59
-
60
-
61
-
62
-
63
-
64
-
65
-
66
-
67
-
68
-
69
-
70
-
71
-
 72
72 -
 73
73 -
 74
74 -
 75
75 -
 76
76 -
 77
77 -
 78
78 -
 79
79 -
 80
80 -
 81
81 -
 82
82 -
 83
83 -
 84
84 -
 85
85 -
 86
86 -
 87
87 -
 88
88 -
 89
89 -
 90
90 -
 91
91 -
 92
92 -
93
-
94
-
95
-
96
-
97
-
98
-
99
-
100
-
101
-
102
-
103
-
104
-
105
-
106
-
107
-
108
-
109
-
110
-
111
-
112
-
113
-
114
-
115
-
116
-
117
-
118
-
119
-
120
-
121
-
122
-
123
-
124
-
125
-
126
-
127
-
128
-
129
-
130
-
131
-
132
-
133
-
134
-
135
-
136
-
137
-
138
-
139
-
140
 |
 |
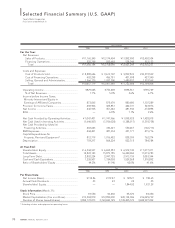
80 ANNUAL REPORT 2007
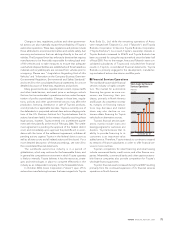
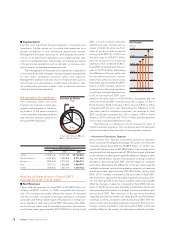
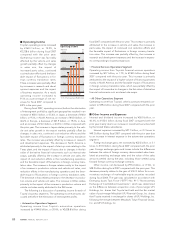
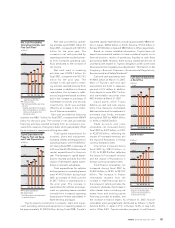
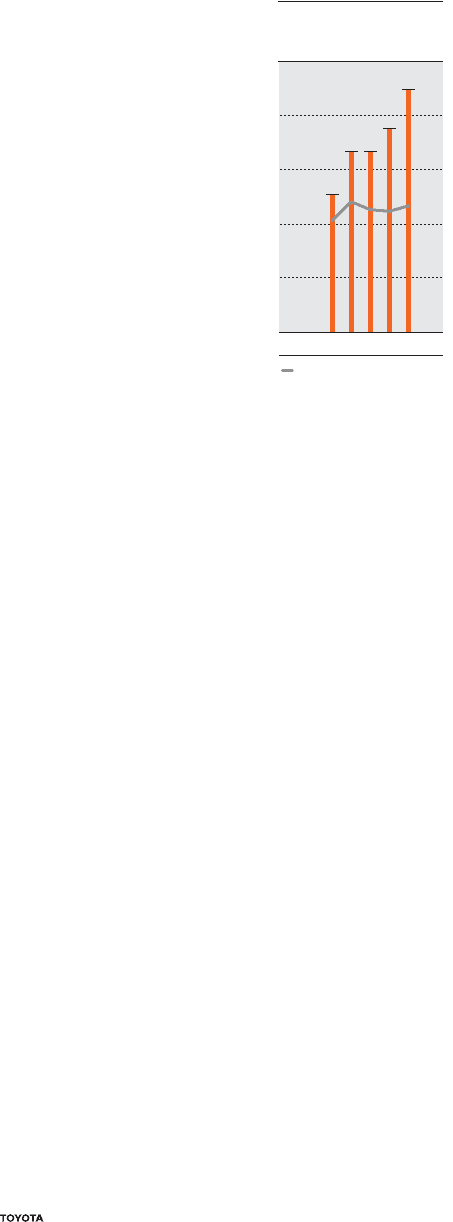
■Operating Income
Toyota’s operating income increased
by ¥360.3 billion, or 19.2%, to
¥2,238.6 billion during fiscal 2007
compared with the prior year.
Operating income was favorably
affected by the vehicle unit sales
growth partially offset by changes
in sales mix, the impact of
increased parts sales, continued
cost reduction efforts and the favor-
able impact of fluctuations in for-
eign currency translation rates.
These increases were partially offset
by increases in research and devel-
opment expenses and the impact
of business expansion. As a result,
operating income increased to
9.3% as a percentage of net rev-
enues for fiscal 2007 compared to
8.9% in the prior year.
During fiscal 2007, operating income (before the elimination
of intersegment profits) by significant geographies resulted in an
increase of ¥381.3 billion, or 35.4%, in Japan, a decrease of ¥46.0
billion, or 9.3%, in North America, an increase of ¥43.4 billion, or
46.2% in Europe, a decrease of ¥27.9 billion, or 19.2%, in Asia,
and an increase of ¥16.3 billion, or 24.3% in Other compared with
the prior year. The increase in Japan relates primarily to the vehi-
cle unit sales growth in the export markets partially offset by
changes in sales mix, continued cost reduction efforts and the
favorable impact of fluctuations in foreign currency translation
rates. The increase was partially offset by increases in research
and development expenses. The decrease in North America is
attributed primarily to the impact of start-up costs relating to the
Texas plant, and the impact of losses due to changes in the fair
value of derivative financial instruments such as interest rate
swaps, partially offset by the increase in vehicle unit sales, the
impact of cost reduction efforts in the manufacturing operations
and the favorable impact of fluctuations in foreign currency trans-
lation rates. The increase in Europe relates mainly to the impact
of an increase in production volume and vehicle unit sales, cost
reduction efforts in the manufacturing operations and the favor-
able impact of fluctuations in foreign currency translation rates.
The decrease in Asia relates primarily to the decrease in produc-
tion volume and vehicle unit sales. The increase in Other relates
primarily to the impact of the increase in production volume and
vehicle unit sales mainly attributed to the IMV series.
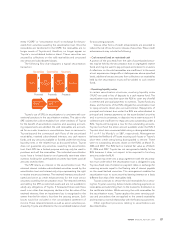
The following is a discussion of operating income for each of
Toyota’s business segments. The operating income amounts dis-
cussed are before the elimination of intersegment profits.
• Automotive Operations Segment
Operating income from Toyota’s automotive operations
increased by ¥344.8 billion, or 20.4%, to ¥2,038.8 billion during
fiscal 2007 compared with the prior year. This increase is primarily
attributed to the increase in vehicle unit sales, the increase in
parts sales, the impact of continued cost reduction efforts and
the favorable impact of fluctuations in foreign currency transla-
tion rates. This increase was partially offset by, the increase in
research and development expenses and the increase in expens-
es corresponding to business expansion.
• Financial Services Operations Segment
Operating income from Toyota’s financial services operations
increased by ¥2.7 billion, or 1.7%, to ¥158.5 billion during fiscal
2007 compared with the prior year. This increase is primarily
attributed to the impact of a higher volume of financing activities
mainly in North America and the favorable impact of fluctuations
in foreign currency translation rates, which was partially offset by
the impact of losses due to changes in the fair value of derivative
financial instruments such as interest rate swaps.
• All Other Operations Segment
Operating income from Toyota’s other businesses remained con-
sistent to ¥39.6 billion during fiscal 2007 compared with the prior
year.
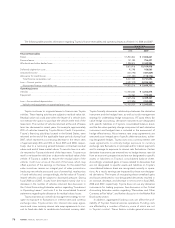
■Other Income and Expenses
Interest and dividend income increased by ¥38.0 billion, or
40.4%, to ¥132.0 billion during fiscal 2007 compared with the
prior year mainly due to an increase in investment securities held
by the United States subsidiaries.
Interest expense increased by ¥27.7 billion, or 2.3 times to
¥49.3 billion during fiscal 2007 compared with the prior year due
to an increase in interest expense in the automotive operations
segment.
Foreign exchange gains, net increased by ¥22.2 billion, or 3.1
times, to ¥33.0 billion during fiscal 2007 compared with the prior
year. Foreign exchange gains and losses include the differences
between the value of foreign currency denominated sales trans-
lated at prevailing exchange rates and the value of the sales
amounts settled during the year, including those settled using
forward foreign currency exchange contracts.
Other income, net decreased by ¥97.6 billion, or 77.6%, to
¥28.2 billion during fiscal 2007 compared with the prior year. This
decrease primarily relates to the gain of ¥143.3 billion for a non-
monetary exchange of marketable equity securities recorded
during fiscal 2006. The gain was calculated in accordance with
Emerging Issues Task Force (“EITF”) No. 91-5 “Nonmonetary
Exchange of Cost-Method Investments”, which was determined
as the difference between acquisition costs of pre-merger UFJ
Holdings, Inc. shares that Toyota had held and the fair market
value of post-merger Mitsubishi UFJ Financial Group, Inc. shares
that Toyota received in exchange for shares of UFJ Holdings, Inc.
following the merger between Mitsubishi Tokyo Financial Group,
Inc. and UFJ Holdings, Inc.
2,500 20
1,500 12
1,000 8
500 4
2,000 16
00
Operating Income
(¥ Billion) (%)
FY ’04’03 ’05 ’06 ’07
% of net revenues (Right scale)