Toyota 2007 Annual Report Download - page 122
Download and view the complete annual report
Please find page 122 of the 2007 Toyota annual report below. You can navigate through the pages in the report by either clicking on the pages listed below, or by using the keyword search tool below to find specific information within the annual report.-
 1
1 -
2
-
3
-
4
-
5
-
6
-
7
-
8
-
9
-
10
-
11
-
12
-
13
-
14
-
15
-
16
-
17
-
18
-
19
-
20
-
21
-
22
-
23
-
24
-
25
-
26
-
27
-
28
-
29
-
30
-
31
-
32
-
33
-
34
-
35
-
36
-
37
-
38
-
39
-
40
-
41
-
42
-
43
-
44
-
45
-
46
-
47
-
48
-
49
-
50
-
51
-
52
-
53
-
54
-
55
-
56
-
57
-
58
-
59
-
60
-
61
-
62
-
63
-
64
-
65
-
66
-
67
-
68
-
69
-
70
-
71
-
72
-
73
-
74
-
75
-
76
-
77
-
78
-
79
-
80
-
81
-
82
-
83
-
84
-
85
-
86
-
87
-
88
-
89
-
90
-
91
-
92
-
93
-
94
-
95
-
96
-
97
-
98
-
99
-
100
-
101
-
102
-
103
-
104
-
105
-
106
-
107
-
108
-
109
-
110
-
111
-
 112
112 -
 113
113 -
 114
114 -
 115
115 -
 116
116 -
 117
117 -
 118
118 -
 119
119 -
 120
120 -
 121
121 -
 122
122 -
 123
123 -
 124
124 -
 125
125 -
 126
126 -
 127
127 -
 128
128 -
 129
129 -
 130
130 -
 131
131 -
 132
132 -
133
-
134
-
135
-
136
-
137
-
138
-
139
-
140
 |
 |

120 ANNUAL REPORT 2007
U.S. dollars
Yen in millions in millions
For the year
ended
For the years ended March 31, March 31,
2005 2006 2007 2007
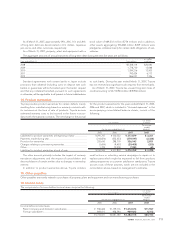
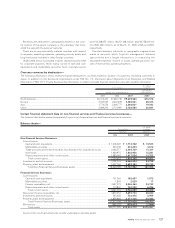
Minimum pension liability adjustments, included in other
comprehensive income...................................................................... ¥9,780 ¥4,937 ¥3,499 $29
The minimum pension liability recognized as of March 31, 2007 was eliminated upon the adoption of the provisions regarding
recognition of funded status and disclosure under FAS 158.
Weighted-average assumptions used to determine benefit obligations as of March 31, 2006 and 2007 are as follows:
March 31,
2006 2007
Discount rate ................................................................................................................................................ 2.6% 2.7%
Rate of compensation increase .................................................................................................................. 0.1–11.0% 0.1–10.0%
Weighted-average assumptions used to determine net periodic pension cost for the years ended March 31, 2005, 2006 and 2007
are as follows:
For the years ended March 31,
2005 2006 2007
Discount rate.......................................................................................................................... 2.2% 2.6% 2.6%
Expected return on plan assets ............................................................................................ 2.1% 2.9% 3.0%
Rate of compensation increase ............................................................................................ 0.5–9.7% 0.1–9.7% 0.1–11.0%
The estimated prior service costs, net actuarial loss and net
transition obligations that will be amortized from accumulated
other comprehensive income into net periodic pension cost
during the year ending March 31, 2008 are ¥(17,300) million
($(147) million), ¥3,400 million ($29 million) and ¥1,900 million
($16 million), respectively.
Prior to the adoption of the provisions regarding recognition
of funded status and disclosure under FAS 158 as of March 31,
2007, Toyota had recorded a minimum pension liability for
plans where the accumulated benefit obligation net of plan
assets exceeded the accrued pension and severance costs. The
minimum pension liability amount at March 31, 2006 was
¥43,980 million. Changes in the minimum pension liability are
reflected as adjustments in other comprehensive income for the
years ended March 31, 2005, 2006 and 2007 as follows:
The expected rate of return on plan assets is determined
after considering several applicable factors including, the com-
position of plan assets held, assumed risks of asset manage-
ment, historical results of the returns on plan assets, Toyota’s
principal policy for plan asset management, and forecasted
market conditions.
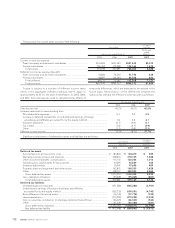
Toyota’s pension plan weighted-average asset allocations as
of March 31, 2006 and 2007, by asset category are as follows:
Toyota’s policy and objective for plan asset management is
to maximize returns on plan assets to meet future benefit pay-
ment requirements under risks which Toyota considers permissible.
Asset allocations under the plan asset management are deter-
mined based on Toyota’s plan asset management guidelines
which are established to achieve the optimized asset composi-
tions in terms of the long-term overall plan asset management.
Prior to making individual investments, Toyota performs in-depth
assessments of corresponding factors including risks, transac-
tion costs and liquidity of each potential investment under
consideration. To measure the performance of the plan asset
management, Toyota establishes bench mark return rates for
each individual investment, combines these individual bench
mark rates based on the asset composition ratios within each
asset category, and compares the combined rates with the
corresponding actual return rates on each asset category.
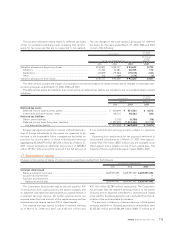
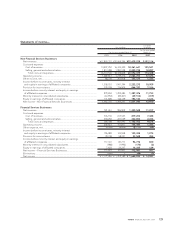
Toyota expects to contribute ¥132,447 million ($1,122 million)
to its pension plan in the year ending March 31, 2008.
The following pension benefit payments, which reflect
expected future service, as appropriate, are expected to be paid:
Plan assets at March 31,
2006 2007
Equity securities ........................................................................................................................................... 68.2% 67.2%
Debt securities ............................................................................................................................................. 18.8 20.8
Real estate .................................................................................................................................................... 0.5 0.7
Other ........................................................................................................................................................... 12.5 11.3
Total .......................................................................................................................................................... 100.0% 100.0%