SkyWest Airlines 2015 Annual Report Download - page 73
Download and view the complete annual report
Please find page 73 of the 2015 SkyWest Airlines annual report below. You can navigate through the pages in the report by either clicking on the pages listed below, or by using the keyword search tool below to find specific information within the annual report.-
 1
1 -
2
-
3
-
4
-
5
-
6
-
7
-
8
-
9
-
10
-
11
-
12
-
13
-
14
-
15
-
16
-
17
-
18
-
19
-
20
-
21
-
22
-
23
-
24
-
25
-
26
-
27
-
28
-
29
-
30
-
31
-
32
-
33
-
34
-
35
-
36
-
37
-
38
-
39
-
40
-
41
-
42
-
43
-
44
-
45
-
46
-
47
-
48
-
49
-
50
-
51
-
52
-
53
-
54
-
55
-
56
-
57
-
58
-
59
-
60
-
61
-
62
-
 63
63 -
 64
64 -
 65
65 -
 66
66 -
 67
67 -
 68
68 -
 69
69 -
 70
70 -
 71
71 -
 72
72 -
 73
73 -
 74
74 -
 75
75 -
 76
76 -
 77
77 -
 78
78 -
 79
79 -
 80
80 -
 81
81 -
 82
82 -
 83
83 -
84
-
85
-
86
-
87
-
88
-
89
-
90
-
91
-
92
-
93
-
94
-
95
-
96
-
97
-
98
-
99
-
100
-
101
-
102
-
103
-
104
-
105
-
106
-
107
-
108
-
109
-
110
-
111
-
112
-
113
-
114
-
115
-
116
-
117
-
118
-
119
-
120
-
121
-
122
-
123
-
124
-
125
-
126
-
127
-
128
-
129
-
130
-
131
-
132
-
133
-
134
-
135
-
136
-
137
-
138
-
139
-
140
-
141
-
142
-
143
-
144
-
145
-
146
-
147
-
148
-
149
-
150
-
151
-
152
-
153
-
154
-
155
-
156
-
157
-
158
-
159
-
160
-
161
 |
 |

69
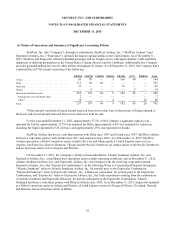
Income Taxes
The Company recognizes a liability or asset for the deferred tax consequences of all temporary differences
between the tax basis of assets and liabilities and their reported amounts in the consolidated financial statements that are
expected to result in taxable or deductible amounts in future years when the reported amounts of the assets and liabilities
are recovered or settled.
Net Income (Loss) Per Common Share
Basic net income (loss) per common share (“Basic EPS”) excludes dilution and is computed by dividing net
income (loss) by the weighted average number of common shares outstanding during the period. Diluted net income
(loss) per common share (“Diluted EPS”) reflects the potential dilution that could occur if stock options or other
contracts to issue common stock were exercised or converted into common stock. The computation of Diluted EPS does
not assume exercise or conversion of securities that would have an anti-dilutive effect on net income (loss) per common
share. During the years ended December 31, 2015, 2014 and 2013, 505,000, 3,191,000 and 3,072,000 shares reserved for
issuance upon the exercise of outstanding options were excluded from the computation of Diluted EPS respectively, as
their inclusion would be anti-dilutive.
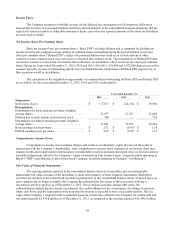
The calculation of the weighted average number of common shares outstanding for Basic EPS and Diluted EPS
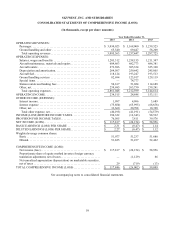
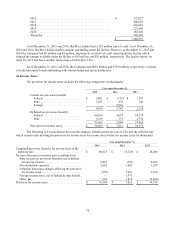
are as follows for the years ended December 31, 2015, 2014 and 2013 (in thousands):
Year Ended December 31,
2015
2014
2013
Numerator:
N
et Income (Loss) ................................. $ 117,817 $ (24,154) $ 58,956
Denominator:
Denominator for basic earnings per-share weighted
average shares ..................................... 51,077 51,237 51,688
Dilution due to stock options and restricted stock . . . . . . . . 748 — 734
Denominator for diluted earnings per-share weighted
average shares ..................................... 51,825 51,237 52,422
Basic earnings (loss) per-share ....................... $ 2.31 $ (0.47) $ 1.14
Diluted earnings (loss) per-share ...................... $ 2.27 $ (0.47) $ 1.12
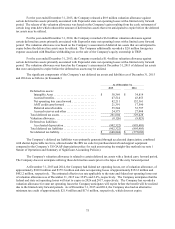
Comprehensive Income (Loss)
Comprehensive income (loss) includes charges and credits to stockholders’ equity that are not the result of
transactions with the Company’s shareholders. Also, comprehensive income (loss) consisted of net income (loss) plus
changes in unrealized appreciation (depreciation) on marketable securities and unrealized gain (loss) on foreign currency
translation adjustment related to the Company’s equity investment in Trip Linhas Aereas, a regional airline operating in
Brazil (“TRIP”) and Mekong Aviation Joint Stock Company, an airline operating in Vietnam (“Air Mekong”).
Fair Value of Financial Instruments
The carrying amounts reported in the consolidated balance sheets for receivables and accounts payable
approximate fair values because of the immediate or short-term maturity of these financial instruments. Marketable
securities are reported at fair value based on market quoted prices in the consolidated balance sheets. If quoted prices in
active markets are no longer available, the Company has estimated the fair values of these securities utilizing a
discounted cash flow analysis as of December 31, 2015. These analyses consider, among other items, the
collateralization underlying the security investments, the creditworthiness of the counterparty, the timing of expected
future cash flows, and the expectation of the next time the security is expected to have a successful auction. The fair
value of the Company’s long-term debt is estimated based on current rates offered to the Company for similar debt and
was approximately $1,939.8 million as of December 31, 2015, as compared to the carrying amount of $1,948.8 million