SkyWest Airlines 2015 Annual Report Download - page 67
Download and view the complete annual report
Please find page 67 of the 2015 SkyWest Airlines annual report below. You can navigate through the pages in the report by either clicking on the pages listed below, or by using the keyword search tool below to find specific information within the annual report.-
 1
1 -
2
-
3
-
4
-
5
-
6
-
7
-
8
-
9
-
10
-
11
-
12
-
13
-
14
-
15
-
16
-
17
-
18
-
19
-
20
-
21
-
22
-
23
-
24
-
25
-
26
-
27
-
28
-
29
-
30
-
31
-
32
-
33
-
34
-
35
-
36
-
37
-
38
-
39
-
40
-
41
-
42
-
43
-
44
-
45
-
46
-
47
-
48
-
49
-
50
-
51
-
52
-
53
-
54
-
55
-
56
-
 57
57 -
 58
58 -
 59
59 -
 60
60 -
 61
61 -
 62
62 -
 63
63 -
 64
64 -
 65
65 -
 66
66 -
 67
67 -
 68
68 -
 69
69 -
 70
70 -
 71
71 -
 72
72 -
 73
73 -
 74
74 -
 75
75 -
 76
76 -
 77
77 -
78
-
79
-
80
-
81
-
82
-
83
-
84
-
85
-
86
-
87
-
88
-
89
-
90
-
91
-
92
-
93
-
94
-
95
-
96
-
97
-
98
-
99
-
100
-
101
-
102
-
103
-
104
-
105
-
106
-
107
-
108
-
109
-
110
-
111
-
112
-
113
-
114
-
115
-
116
-
117
-
118
-
119
-
120
-
121
-
122
-
123
-
124
-
125
-
126
-
127
-
128
-
129
-
130
-
131
-
132
-
133
-
134
-
135
-
136
-
137
-
138
-
139
-
140
-
141
-
142
-
143
-
144
-
145
-
146
-
147
-
148
-
149
-
150
-
151
-
152
-
153
-
154
-
155
-
156
-
157
-
158
-
159
-
160
-
161
 |
 |

63
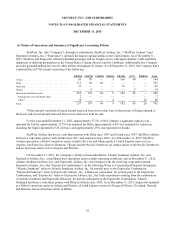
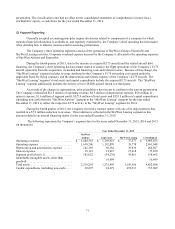
Basis of Presentation
The Company’s consolidated financial statements include the accounts of SkyWest, Inc. and its subsidiaries,
including SkyWest Airlines and ExpressJet, with all inter-company transactions and balances having been eliminated.
In preparing the accompanying consolidated financial statements, the Company has reviewed, as determined
necessary by the Company’s management, events that have occurred after December 31, 2015, through the filing date of
the Company’s annual report with the U.S. Securities and Exchange Commission.
Use of Estimates
The preparation of financial statements in conformity with accounting principles generally accepted in the
United States of America requires management to make estimates and assumptions that affect the reported amounts of
assets and liabilities and disclosure of contingent assets and liabilities at the date of the financial statements and the
reported amounts of revenues and expenses during the reporting period. Actual results could differ from those estimates.
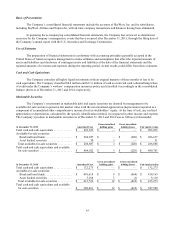
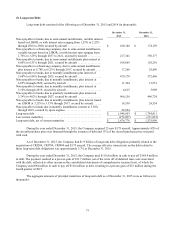
Cash and Cash Equivalents
The Company considers all highly liquid investments with an original maturity of three months or less to be
cash equivalents. The Company classified $8.2 million and $11.6 million of cash as restricted cash collateralizing letters
of credit under the Company’s workers’ compensation insurance policy and classified it accordingly in the consolidated
balance sheets as of December 31, 2015 and 2014, respectively.
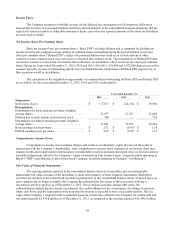
Marketable Securities
The Company’s investments in marketable debt and equity securities are deemed by management to be
available-for-sale and are reported at fair market value with the net unrealized appreciation (depreciation) reported as a
component of accumulated other comprehensive income (loss) in stockholders’ equity. At the time of sale, any realized
appreciation or depreciation, calculated by the specific identification method, is recognized in other income and expense.
The Company’s position in marketable securities as of December 31, 2015 and 2014 was as follows (in thousands):
Gross unrealized Gross unrealized
At December 31, 2015 Amortized Cost holding gains holding losses Fair market value
Total cash and cash equivalents .............
$ 203,035
$ —
$ —
$ 203,035
Available-for-sale securities:
Bond and bond funds ...................
$ 286,857
$ —
$ (220)
$ 286,637
Asset backed securities .................
30
1
—
31
Total available-for-sale securities ..........
$ 286,887
$ 1
$ (220)
$ 286,668
Total cash and cash equivalents and available
for sale securities . . . ....................
$ 489,922
$ 1
$ (220)
$ 489,703
Gross unrealized
Gross unrealized
At December 31, 2014 Amortized Cost holding gains holding losses Fair market value
Total cash and cash equivalents .............
$ 132,275
$—
$—
$ 132,275
Available-for-sale securities:
Bond and bond funds ...................
$ 410,618
$ 9
$ (464)
$ 410,163
Asset backed securities .................
5,108
3
(1)
5,110
Total available-for-sale securities ..........
$ 415,726
$ 12
$ (465)
$ 415,273
Total cash and cash equivalents and available
for sale securities . . . ....................
$ 548,001
$ 12
$ (465)
$ 547,548