SkyWest Airlines 2015 Annual Report Download - page 46
Download and view the complete annual report
Please find page 46 of the 2015 SkyWest Airlines annual report below. You can navigate through the pages in the report by either clicking on the pages listed below, or by using the keyword search tool below to find specific information within the annual report.-
 1
1 -
2
-
3
-
4
-
5
-
6
-
7
-
8
-
9
-
10
-
11
-
12
-
13
-
14
-
15
-
16
-
17
-
18
-
19
-
20
-
21
-
22
-
23
-
24
-
25
-
26
-
27
-
28
-
29
-
30
-
31
-
32
-
33
-
34
-
35
-
 36
36 -
 37
37 -
 38
38 -
 39
39 -
 40
40 -
 41
41 -
 42
42 -
 43
43 -
 44
44 -
 45
45 -
 46
46 -
 47
47 -
 48
48 -
 49
49 -
 50
50 -
 51
51 -
 52
52 -
 53
53 -
 54
54 -
 55
55 -
 56
56 -
57
-
58
-
59
-
60
-
61
-
62
-
63
-
64
-
65
-
66
-
67
-
68
-
69
-
70
-
71
-
72
-
73
-
74
-
75
-
76
-
77
-
78
-
79
-
80
-
81
-
82
-
83
-
84
-
85
-
86
-
87
-
88
-
89
-
90
-
91
-
92
-
93
-
94
-
95
-
96
-
97
-
98
-
99
-
100
-
101
-
102
-
103
-
104
-
105
-
106
-
107
-
108
-
109
-
110
-
111
-
112
-
113
-
114
-
115
-
116
-
117
-
118
-
119
-
120
-
121
-
122
-
123
-
124
-
125
-
126
-
127
-
128
-
129
-
130
-
131
-
132
-
133
-
134
-
135
-
136
-
137
-
138
-
139
-
140
-
141
-
142
-
143
-
144
-
145
-
146
-
147
-
148
-
149
-
150
-
151
-
152
-
153
-
154
-
155
-
156
-
157
-
158
-
159
-
160
-
161
 |
 |

42
with the sale of our paint facility located in Saltillo, Mexico during 2014. These discrete income tax provision items were
partially offset by the income tax benefit associated with our loss before income tax of $16.3 million for 2014.
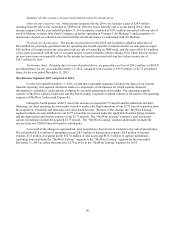
Net Income (loss). Primarily due to factors described above, we generated net income of $117.8 million, or
$2.27 per diluted share, for the year ended December 31, 2015, compared to net loss of $24.2 million, or $(0.47) per
diluted share, for the year ended December 31, 2014.
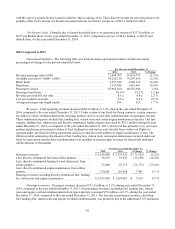
2014 Compared to 2013
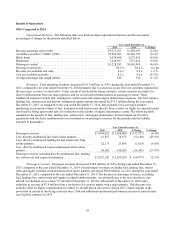
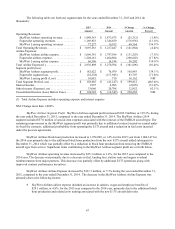
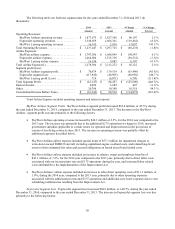
Operational Statistics. The following table sets forth our major operational statistics and the associated
percentages-of-change for the periods identified below.
For the year ended December 31,
2014 2013 % Change
Revenue passenger miles (000) .................................... 31,499,397 31,834,735 (1.1)%
Available seat miles (“ASMs”) (000) ............................... 38,220,150 39,207,910 (2.5)%
Block hours .................................................... 2,275,562 2,380,118 (4.4)%
Departures ..................................................... 1,357,454 1,453,601 (6.6)%
Passengers carried ............................................... 58,962,010 60,581,948 (3)%
Passenger load factor ............................................. 82.4% 81.2 % 1.2pts
Revenue per available seat mile .................................... 8.5¢ 8.4 ¢ 1.2%
Cost per available seat mile ....................................... 8.6¢ 8.2 ¢ 4.9%
Average passenger trip length (miles) ............................... 534 525 1.7%
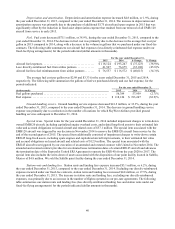
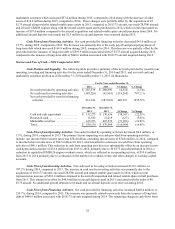
Revenues. Total operating revenues decreased $60.3 million, or 1.8%, during the year ended December 31,
2014, compared to the year ended December 31, 2013. Under certain of our fixed-fee flying contracts, certain expenses
are subject to direct reimbursement from our major partners and we record such reimbursements as passenger revenue.
These reimbursed expenses include fuel, landing fees, station rents and certain engine maintenance expenses. Our fuel
expense, landing fees, station rents and directly-reimbursed engine expense decreased by $79.1 million during the year
ended December 31, 2014, as compared to the year ended December 31, 2013, which was due primarily to (i) our major
partners purchasing an increased volume of fuel, landing fees and station rents directly from vendors on flights we
operated under our fixed-fee flying agreements and (ii) a reduction in the number of engine maintenance events. The
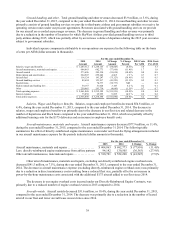
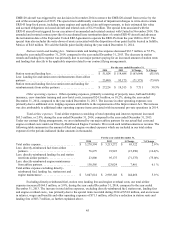
following table summarizes the amount of fuel, landing fees, station rents, and engine maintenance incurred under our
fixed-fee agreements and the direct reimbursement was included in our passenger revenues for the periods indicated
(dollar amounts in thousands).
For the year ended December 31,
2014 2013 $ Change % Change
Passenger revenues ..................................... $ 3,168,000 $ 3,239,525 $ (71,525) (2.2)%
Less: directly-reimbursed fuel from airline partners ........... 76,675 91,925 (15,250) (16.6)%
Less: directly-reimbursed landing fee and station rent from
airline partners ......................................... 23,800 95,175 (71,375) (75.0)%
Less: directly-reimbursed engine maintenance from airline
partners ............................................... 130,505 123,024 7,481 6.1%
Passenger revenue excluding directly-reimbursed fuel, landing
fee, station rent and engine maintenance . . . . . . . . . . . . . . . . . . . . $ 2,937,020 $ 2,929,401 $ 7,619 0.3 %
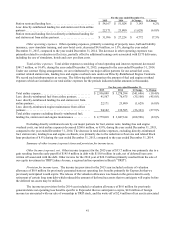
Passenger revenues. Passenger revenues decreased $71.5 million, or 2.2%, during year ended December 31,
2014, compared to the year ended December 31, 2013. Our passenger revenues, excluding fuel, landing fees, station
rents and engine overhaul reimbursements from major partners, increased $7.6 million, or 0.3%, during the year ended
December 31, 2014, compared to the year ended December 31, 2013. The increase in passenger revenues, excluding
fuel, landing fees, station rents and engine overhaul reimbursements, was primarily due to the additional E175 operations