SkyWest Airlines 2015 Annual Report Download - page 68
Download and view the complete annual report
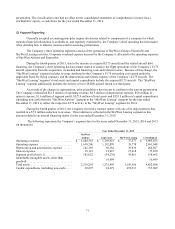
Please find page 68 of the 2015 SkyWest Airlines annual report below. You can navigate through the pages in the report by either clicking on the pages listed below, or by using the keyword search tool below to find specific information within the annual report.-
 1
1 -
2
-
3
-
4
-
5
-
6
-
7
-
8
-
9
-
10
-
11
-
12
-
13
-
14
-
15
-
16
-
17
-
18
-
19
-
20
-
21
-
22
-
23
-
24
-
25
-
26
-
27
-
28
-
29
-
30
-
31
-
32
-
33
-
34
-
35
-
36
-
37
-
38
-
39
-
40
-
41
-
42
-
43
-
44
-
45
-
46
-
47
-
48
-
49
-
50
-
51
-
52
-
53
-
54
-
55
-
56
-
57
-
 58
58 -
 59
59 -
 60
60 -
 61
61 -
 62
62 -
 63
63 -
 64
64 -
 65
65 -
 66
66 -
 67
67 -
 68
68 -
 69
69 -
 70
70 -
 71
71 -
 72
72 -
 73
73 -
 74
74 -
 75
75 -
 76
76 -
 77
77 -
 78
78 -
79
-
80
-
81
-
82
-
83
-
84
-
85
-
86
-
87
-
88
-
89
-
90
-
91
-
92
-
93
-
94
-
95
-
96
-
97
-
98
-
99
-
100
-
101
-
102
-
103
-
104
-
105
-
106
-
107
-
108
-
109
-
110
-
111
-
112
-
113
-
114
-
115
-
116
-
117
-
118
-
119
-
120
-
121
-
122
-
123
-
124
-
125
-
126
-
127
-
128
-
129
-
130
-
131
-
132
-
133
-
134
-
135
-
136
-
137
-
138
-
139
-
140
-
141
-
142
-
143
-
144
-
145
-
146
-
147
-
148
-
149
-
150
-
151
-
152
-
153
-
154
-
155
-
156
-
157
-
158
-
159
-
160
-
161
 |
 |

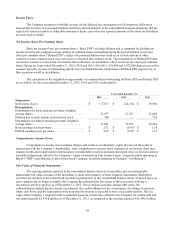
64
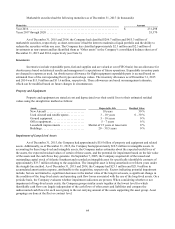
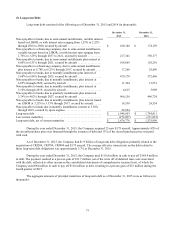
Marketable securities had the following maturities as of December 31, 2015 (in thousands):
Maturities
Amount
Year 2016 ............................................................... $ 231,298
Years 2017 through 2020 .................................................. 55,370
As of December 31, 2015 and 2014, the Company had classified $286.7 million and $415.3 million of
marketable securities, respectively, as short-term since it had the intent to maintain a liquid portfolio and the ability to
redeem the securities within one year. The Company has classified approximately $2.3 million and $2.3 million of
investments as non-current and has identified them as “Other assets” in the Company’s consolidated balance sheet as of
December 31, 2015 and 2014, respectively (see Note 6).
Inventories
Inventories include expendable parts, fuel and supplies and are valued at cost (FIFO basis) less an allowance for
obsolescence based on historical results and management’s expectations of future operations. Expendable inventory parts
are charged to expense as used. An obsolescence allowance for flight equipment expendable parts is accrued based on
estimated lives of the corresponding fleet types and salvage values. The inventory allowance as of December 31, 2015
and 2014 was $13.9 million and $11.6 million, respectively. These allowances are based on management estimates,
which can be modified based on future changes in circumstances.
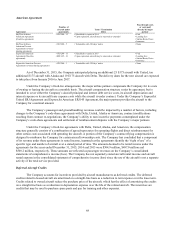
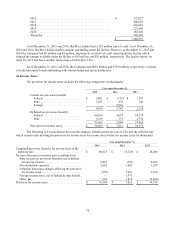
Property and Equipment
Property and equipment are stated at cost and depreciated over their useful lives to their estimated residual
values using the straight-line method as follows:
Assets Depreciable Life Residual Value
N
ew Aircraft ........................... 18 years 30 %
Used Aircraft and rotable spares ........... 3 – 10 years 0 - 30 %
Ground equipment ....................... 5 – 10 years 0 %
Office equipment ........................ 5 – 7 years 0 %
Leasehold improvements ................. Shorter of 15 years or lease term 0 %
Buildings .............................. 20 – 39.5 years 0 %
Impairment of Long-Lived Assets
As of December 31, 2015, the Company had approximately $5.6 billion of property and equipment and related
assets. Additionally, as of December 31, 2015, the Company had approximately $10.5 million in intangible assets. In
accounting for these long-lived and intangible assets, the Company makes estimates about the expected useful lives of
the assets, the expected residual values of certain of these assets, and the potential for impairment based on the fair value
of the assets and the cash flows they generate. On September 7, 2005, the Company acquired all of the issued and
outstanding capital stock of Atlantic Southeast and recorded an intangible asset for specifically identifiable contracts of
approximately $33.7 million relating to the acquisition. The intangible asset is being amortized over fifteen years under
the straight-line method. As of December 31, 2015 and 2014, the Company had $23.3 million and $21.0 million in
accumulated amortization expense, attributable to the acquisition, respectively. Factors indicating potential impairment
include, but are not limited to, significant decreases in the market value of the long-lived assets, a significant change in
the condition of the long-lived assets and operating cash flow losses associated with the use of the long-lived assets. On a
periodic basis, the Company evaluates whether impairment indicators are present. When considering whether or not
impairment of long-lived assets exists, the Company groups similar assets together at the lowest level for which
identifiable cash flows are largely independent of the cash flows of other assets and liabilities and compare the
undiscounted cash flows for each asset group to the net carrying amount of the assets supporting the asset group. Asset
groupings are done at the fleet or contract level.