SkyWest Airlines 2015 Annual Report Download - page 55
Download and view the complete annual report
Please find page 55 of the 2015 SkyWest Airlines annual report below. You can navigate through the pages in the report by either clicking on the pages listed below, or by using the keyword search tool below to find specific information within the annual report.-
 1
1 -
2
-
3
-
4
-
5
-
6
-
7
-
8
-
9
-
10
-
11
-
12
-
13
-
14
-
15
-
16
-
17
-
18
-
19
-
20
-
21
-
22
-
23
-
24
-
25
-
26
-
27
-
28
-
29
-
30
-
31
-
32
-
33
-
34
-
35
-
36
-
37
-
38
-
39
-
40
-
41
-
42
-
43
-
44
-
 45
45 -
 46
46 -
 47
47 -
 48
48 -
 49
49 -
 50
50 -
 51
51 -
 52
52 -
 53
53 -
 54
54 -
 55
55 -
 56
56 -
 57
57 -
 58
58 -
 59
59 -
 60
60 -
 61
61 -
 62
62 -
 63
63 -
 64
64 -
 65
65 -
66
-
67
-
68
-
69
-
70
-
71
-
72
-
73
-
74
-
75
-
76
-
77
-
78
-
79
-
80
-
81
-
82
-
83
-
84
-
85
-
86
-
87
-
88
-
89
-
90
-
91
-
92
-
93
-
94
-
95
-
96
-
97
-
98
-
99
-
100
-
101
-
102
-
103
-
104
-
105
-
106
-
107
-
108
-
109
-
110
-
111
-
112
-
113
-
114
-
115
-
116
-
117
-
118
-
119
-
120
-
121
-
122
-
123
-
124
-
125
-
126
-
127
-
128
-
129
-
130
-
131
-
132
-
133
-
134
-
135
-
136
-
137
-
138
-
139
-
140
-
141
-
142
-
143
-
144
-
145
-
146
-
147
-
148
-
149
-
150
-
151
-
152
-
153
-
154
-
155
-
156
-
157
-
158
-
159
-
160
-
161
 |
 |

51
• ExpressJet’s operating revenue decreased by $119.5 million, or 8.1%, for the 2014 year compared to the
2013 year. The decrease in operating revenue was primarily due to a reduction in the ExpressJet fleet size
and severe weather that negatively impacted the operations in the first half of 2014. These two factors
resulted in a decrease in block hour production of 107,220 hours at ExpressJet, or 8.1%, for 2014 compared
to 2013.
• ExpressJet airlines 2014 expenses included special items of $12.9 million for impairment charges to
write-down certain ERJ145 long-lived assets, including spare engines and capitalized aircraft
Improvements, to their estimated fair value and accrued obligations on leased aircraft and related costs.
ExpressJet also had $4.8 million in special charges associated with the write-down of its paint facility
located in Saltillo, Mexico that was sold in 2014.
• ExpressJet’s airline expense decreased $50.5 million, or 3.3%, for the 2014 year compared to the
2013 year. The decrease was not proportionate to the decrease in operating revenue for the comparable
periods due to the inefficiencies and costs associated with the weather cancellations experienced in the first
half of 2014 and additional expenses, including pilot training, associated with the implementation of the
Improvement Act in 2014 compared to 2013.
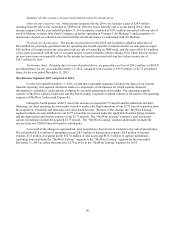
SkyWest Leasing Profit (Loss). SkyWest Leasing profit increased $6.8 million during the year ended December
31, 2014, compared to the year ended December 31, 2013, primarily due to the additional E175 aircraft revenue
attributed to the ownership costs of the E175 aircraft earned under the applicable fixed-fee flying contracts and
profitability offset by the E175 aircraft depreciation and interest expense. SkyWest Leasing profit(loss) for 2013 was
primarily due to maintenance costs associated with transferring aircraft costs from Air Mekong to SkyWest Airlines.
Liquidity and Capital Resources
Sources and Uses of Cash—2015 Compared to 2014
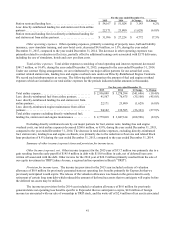
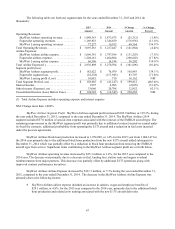
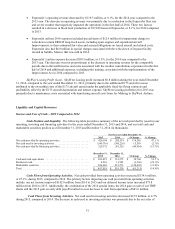
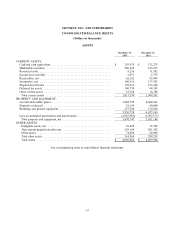
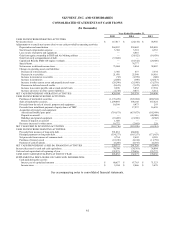
Cash Position and Liquidity. The following table provides a summary of the net cash provided by (used in) our
operating, investing and financing activities for the years ended December 31, 2015 and 2014, and our total cash and
marketable securities position as of December 31, 2015 and December 31, 2014 (in thousands).
For the year ended December 31,
2015 2014 $ Change % Change
N
et cash provided by operating activities ...................... $ 420,104 $ 285,539 $ 134,565 47.1%
N
et cash used in investing activities .......................... (569,716) (585,226) 15,510 (2.7)%
N
et cash provided by financing activities ...................... 220,372 261,326 (40,954) (15.7)%
December 31, December 31,
2015 2014 $ Change % Change
Cash and cash equivalents .................................. $ 203,035 $ 132,275 $ 70,760 53.5%
Restricted cash ........................................... 8,216 11,582 (3,366) (29.1)%
Marketable securities ...................................... 286,668 415,273 (128,605) (31.0)%
Total ................................................... $ 497,919 $ 559,130 $ (61,211) (10.9)%
Cash Flows from Operating Activities. Net cash provided from operating activities increased $134.6 million,
or 47.1%, during 2015, compared to 2014. The primary factors impacting our cash provided from operating activities
include: our net income improved $142.0 million from 2014 to 2015 and our deferred income taxes increased $73.8
million from 2014 to 2015. Additionally, the combination of the 2014 special items, the 2014 gain on sale of our TRIP
shares and the 2015 gain on early debt payoff resulted in a net decrease to cash from operations of $83.6 million.
Cash Flows from Investing Activities. Net cash used in investing activities decreased $15.5 million, or 2.7%
during 2015, compared to 2014. The decrease in cash used in investing activities was primarily due to the net sales of