SkyWest Airlines 2015 Annual Report Download - page 35
Download and view the complete annual report
Please find page 35 of the 2015 SkyWest Airlines annual report below. You can navigate through the pages in the report by either clicking on the pages listed below, or by using the keyword search tool below to find specific information within the annual report.-
 1
1 -
2
-
3
-
4
-
5
-
6
-
7
-
8
-
9
-
10
-
11
-
12
-
13
-
14
-
15
-
16
-
17
-
18
-
19
-
20
-
21
-
22
-
23
-
24
-
 25
25 -
 26
26 -
 27
27 -
 28
28 -
 29
29 -
 30
30 -
 31
31 -
 32
32 -
 33
33 -
 34
34 -
 35
35 -
 36
36 -
 37
37 -
 38
38 -
 39
39 -
 40
40 -
 41
41 -
 42
42 -
 43
43 -
 44
44 -
 45
45 -
46
-
47
-
48
-
49
-
50
-
51
-
52
-
53
-
54
-
55
-
56
-
57
-
58
-
59
-
60
-
61
-
62
-
63
-
64
-
65
-
66
-
67
-
68
-
69
-
70
-
71
-
72
-
73
-
74
-
75
-
76
-
77
-
78
-
79
-
80
-
81
-
82
-
83
-
84
-
85
-
86
-
87
-
88
-
89
-
90
-
91
-
92
-
93
-
94
-
95
-
96
-
97
-
98
-
99
-
100
-
101
-
102
-
103
-
104
-
105
-
106
-
107
-
108
-
109
-
110
-
111
-
112
-
113
-
114
-
115
-
116
-
117
-
118
-
119
-
120
-
121
-
122
-
123
-
124
-
125
-
126
-
127
-
128
-
129
-
130
-
131
-
132
-
133
-
134
-
135
-
136
-
137
-
138
-
139
-
140
-
141
-
142
-
143
-
144
-
145
-
146
-
147
-
148
-
149
-
150
-
151
-
152
-
153
-
154
-
155
-
156
-
157
-
158
-
159
-
160
-
161
 |
 |

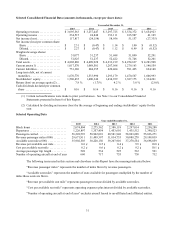
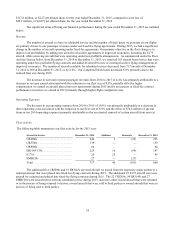
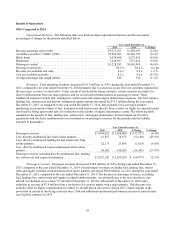
31
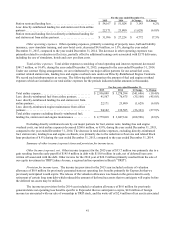
Selected Consolidated Financial Data (amounts in thousands, except per share data):
Year ended December 31,
2015
2014
2013
2012
2011
Operating revenues ............... $ 3,095,563 $ 3,237,447 $ 3,297,725 $ 3,534,372 $ 3,654,923
Operating income ................ 234,515 24,848 153,111 165,987 41,105
N
et income (loss) ................. 117,817 (24,154) 58,956 51,157 (27,335)
N
et income (loss) per common share:
Basic ........................ $ 2.31 $ (0.47) $ 1.14 $ 1.00 $ (0.52)
Diluted ....................... $ 2.27 $ (0.47) $ 1.12 $ 0.99 $ (0.52)
Weighted average shares:
Basic ........................ 51,077 51,237 51,688 51,090 52,201
Diluted ....................... 51,825 51,237 52,422 51,746 52,201
Total assets ...................... $ 4,802,886 $ 4,409,928 $ 4,233,219 $ 4,254,637 $ 4,281,908
Current assets(1) ................. 1,017,570 1,089,501 1,287,568 1,279,163 1,146,559
Current liabilities . . . . . ............ 751,386 684,355 620,464 591,425 624,148
Long-term debt, net of current
maturities . . . . . . . . . . . ........... 1,676,776 1,533,990 1,293,179 1,470,567 1,606,993
Stockholders’ equity .............. 1,506,435 1,400,346 1,434,939 1,387,175 1,334,261
Return (loss) on average equity(2) . . . 7.8 % (1.7)% 4.2 % 3.8 % (2.0)%
Cash dividends declared per common
share ......................... $ 0.16 $ 0.16 $ 0.16 $ 0.16 $ 0.16
(1) Certain reclassifications were made to prior year balances. See Note 1 to our Consolidated Financial
Statements presented in Item 8 of this Report.
(2) Calculated by dividing net income (loss) by the average of beginning and ending stockholders’ equity for the
year.
Selected Operating Data
Year ended December 31,
2015
2014
2013
2012
2011
Block hours ......................... 2,074,804 2,275,562 2,380,118 2,297,014 2,250,280
Departures .......................... 1,226,897 1,357,454 1,453,601 1,435,512 1,390,523
Passengers carried .................... 56,228,593 58,962,010 60,581,948 58,803,690 55,836,271
Revenue passenger miles (000) ......... 29,671,911 31,499,397 31,834,735 30,088,278 29,109,039
Available seat miles (000) ............. 35,902,503 38,220,150 39,207,910 37,278,554 36,698,859
Revenue per available seat mile ......... 8.6¢ 8.5¢ 8.4¢ 9.5 ¢ 10.0¢
Cost per available seat mile ............ 8.2¢ 8.6¢ 8.2¢ 9.2 ¢ 10.1¢
Average passenger trip length .......... 528 534 525 512 521
N
umber of operating aircraft at end of yea
r
660 717 755 738 732
The following terms used in this section and elsewhere in this Report have the meanings indicated below:
“Revenue passenger miles” represents the number of miles flown by revenue passengers.
“Available seat miles” represents the number of seats available for passengers multiplied by the number of
miles those seats are flown.
“Revenue per available seat mile” represents passenger revenue divided by available seat miles.
“Cost per available seat mile” represents operating expenses plus interest divided by available seat miles.
“Number of operating aircraft at end of year” excludes aircraft leased to un-affiliated and affiliated entities.