SkyWest Airlines 2008 Annual Report Download - page 81
Download and view the complete annual report
Please find page 81 of the 2008 SkyWest Airlines annual report below. You can navigate through the pages in the report by either clicking on the pages listed below, or by using the keyword search tool below to find specific information within the annual report.-
 1
1 -
2
-
3
-
4
-
5
-
6
-
7
-
8
-
9
-
10
-
11
-
12
-
13
-
14
-
15
-
16
-
17
-
18
-
19
-
20
-
21
-
22
-
23
-
24
-
25
-
26
-
27
-
28
-
29
-
30
-
31
-
32
-
33
-
34
-
35
-
36
-
37
-
38
-
39
-
40
-
41
-
42
-
43
-
44
-
45
-
46
-
47
-
48
-
49
-
50
-
51
-
52
-
53
-
54
-
55
-
56
-
57
-
58
-
59
-
60
-
61
-
62
-
63
-
64
-
65
-
66
-
67
-
68
-
69
-
70
-
 71
71 -
 72
72 -
 73
73 -
 74
74 -
 75
75 -
 76
76 -
 77
77 -
 78
78 -
 79
79 -
 80
80 -
 81
81 -
 82
82 -
 83
83 -
 84
84 -
 85
85 -
 86
86 -
 87
87 -
 88
88 -
 89
89 -
 90
90 -
 91
91 -
92
-
93
-
94
-
95
-
96
-
97
-
98
-
99
-
100
-
101
-
102
-
103
-
104
-
105
-
106
-
107
-
108
-
109
-
110
-
111
-
112
-
113
-
114
-
115
-
116
-
117
-
118
-
119
-
120
-
121
-
122
-
123
-
124
-
125
-
126
-
127
-
128
-
129
-
130
-
131
-
132
-
133
-
134
-
135
-
136
-
137
-
138
-
139
-
140
-
141
-
142
-
143
-
144
-
145
-
146
-
147
-
148
-
149
-
150
-
151
-
152
 |
 |

SKYWEST, INC. AND SUBSIDIARIES
NOTES TO CONSOLIDATED FINANCIAL STATEMENTS (Continued)
DECEMBER 31, 2008
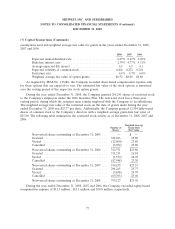
(7) Capital Transactions (Continued)
assumptions used and weighted average fair value for grants in the years ended December 31, 2008,
2007 and 2006.
2008 2007 2006
Expected annual dividend rate ....................... 0.47% 0.45% 0.70%
Risk-free interest rate ............................. 2.39% 4.77% 4.31%
Average expected life (years) ........................ 4.3 4.5 4.1
Expected volatility of common stock ................... 0.264 0.272 0.294
Forfeiture rate ................................... 4.4% 4.7% 6.0%
Weighted average fair value of option grants ............. $6.32 $8.06 $6.80
As required by SFAS No. 123(R), the Company recorded share-based compensation expense only
for those options that are expected to vest. The estimated fair value of the stock options is amortized
over the vesting period of the respective stock option grants.
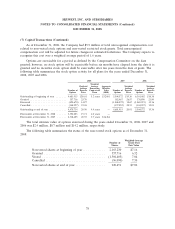
During the year ended December 31, 2008, the Company granted 296,245 shares of restricted stock
to the Company’s employees under the 2006 Incentive Plan. The restricted stock has a three-year
vesting period, during which the recipient must remain employed with the Company or its subsidiaries.
The weighted average fair value of the restricted stock on the date of grants made during the year
ended December 31, 2008 was $25.77 per share. Additionally, the Company granted 13,304 fully-vested
shares of common stock to the Company’s directors with a weighted average grant-date fair value of
$25.80. The following table summarizes the restricted stock activity as of December 31, 2008, 2007 and
2006:
Weighted-Average
Number of Grant-Date
Shares Fair Value
Non-vested shares outstanding at December 31, 2005 . . . — $ —
Granted .................................... 330,423 23.80
Vested ..................................... (12,600) 23.80
Cancelled ................................... (5,072) 23.80
Non-vested shares outstanding at December 31, 2006 . . . 312,751 $23.80
Granted .................................... 311,211 26.84
Vested ..................................... (1,579) 24.07
Cancelled ................................... (87,948) 25.30
Non-vested shares outstanding at December 31, 2007 . . . 534,435 $25.35
Granted .................................... 296,245 25.77
Vested ..................................... (5,848) 24.79
Cancelled ................................... (69,705) 25.60
Non-vested shares outstanding at December 31, 2008 . . . 755,127 $25.50
During the year ended December 31, 2008, 2007 and 2006, the Company recorded equity-based
compensation expense of $11.5 million , $13.1 million and $10.8 million, respectively.
77