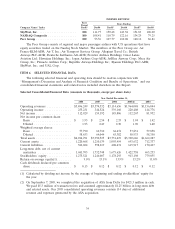
SkyWest Airlines 2008 Annual Report Download - page 45
Download and view the complete annual report
Please find page 45 of the 2008 SkyWest Airlines annual report below. You can navigate through the pages in the report by either clicking on the pages listed below, or by using the keyword search tool below to find specific information within the annual report.-
 1
1 -
2
-
3
-
4
-
5
-
6
-
7
-
8
-
9
-
10
-
11
-
12
-
13
-
14
-
15
-
16
-
17
-
18
-
19
-
20
-
21
-
22
-
23
-
24
-
25
-
26
-
27
-
28
-
29
-
30
-
31
-
32
-
33
-
34
-
 35
35 -
 36
36 -
 37
37 -
 38
38 -
 39
39 -
 40
40 -
 41
41 -
 42
42 -
 43
43 -
 44
44 -
 45
45 -
 46
46 -
 47
47 -
 48
48 -
 49
49 -
 50
50 -
 51
51 -
 52
52 -
 53
53 -
 54
54 -
 55
55 -
56
-
57
-
58
-
59
-
60
-
61
-
62
-
63
-
64
-
65
-
66
-
67
-
68
-
69
-
70
-
71
-
72
-
73
-
74
-
75
-
76
-
77
-
78
-
79
-
80
-
81
-
82
-
83
-
84
-
85
-
86
-
87
-
88
-
89
-
90
-
91
-
92
-
93
-
94
-
95
-
96
-
97
-
98
-
99
-
100
-
101
-
102
-
103
-
104
-
105
-
106
-
107
-
108
-
109
-
110
-
111
-
112
-
113
-
114
-
115
-
116
-
117
-
118
-
119
-
120
-
121
-
122
-
123
-
124
-
125
-
126
-
127
-
128
-
129
-
130
-
131
-
132
-
133
-
134
-
135
-
136
-
137
-
138
-
139
-
140
-
141
-
142
-
143
-
144
-
145
-
146
-
147
-
148
-
149
-
150
-
151
-
152
 |
 |

Fair value
We have adopted SFAS No. 157 ‘‘Fair Value Measurements’’ (‘‘SFAS 157’’) as it applies to
financial assets and liabilities effective January 1, 2008. SFAS 157 defines fair value, establishes a
framework for measuring fair value under generally accepted accounting principles (‘‘GAAP’’) and
enhances disclosures about fair value measurements. Fair value is defined under SFAS 157 as the
exchange price that would be received for an asset or paid to transfer a liability (an exit price) in the
principal or most advantageous market for the asset or liability in an orderly transaction between
market participants on the measurement date. For additional information on the fair value of certain
financial assets and liabilities, see Note 5 to our consolidated financial statements.
Under SFAS 157, we utilize several valuation techniques in order to assess the fair value of our
financial assets and liabilities. Our cash and cash equivalents primarily utilize quoted prices in active
markets for identical assets or liabilities.
We have valued non-auction rate marketable securities using quoted prices in active markets for
identical assets or liabilities. If a quoted price is not available, we utilize broker quotes in a non-active
market for valuation of these securities. For auction-rate security instruments, quoted prices in active
markets are no longer available. As a result, we have estimated the fair values of these securities
utilizing a discounted cash flow.
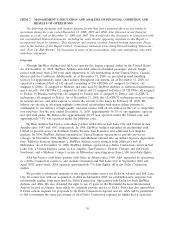
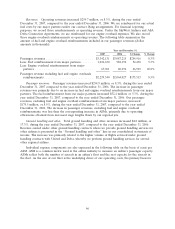
Results of Operations
2008 Compared to 2007
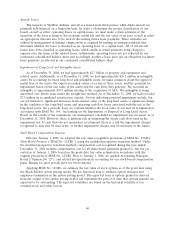
Operational Statistics. The following table sets forth our major operational statistics and the
associated percentages-of-change for the periods identified below.
Year ended December 31,
2008 2007 % Change
Revenue passenger miles (000) .......................... 17,101,910 17,892,282 (4.4)
Available seat miles (‘‘ASMs’’) (000) ...................... 22,020,250 22,968,768 (4.1)
Block hours ........................................ 1,376,815 1,438,818 (4.3)
Departures ......................................... 872,288 904,795 (3.6)
Passengers carried .................................... 33,461,819 34,392,755 (2.7)
Passenger load factor ................................. 77.7% 77.9% (0.2)pts
Revenue per available seat mile .......................... 15.9¢ 14.7¢ 8.2
Cost per available seat mile ............................. 15.2¢ 13.7¢ 10.9
Fuel cost per available seat mile ......................... 5.5¢ 4.6¢ 19.6
Average passenger trip length (miles) ...................... 511 520 (1.7)
Revenues. Operating revenues increased $121.9 million, or 3.6%, during the year ended
December 31, 2008, compared to the year ended December 31, 2007. We are reimbursed for our actual
fuel costs by our major partners under our contract flying arrangements. For financial reporting
purposes, we record these reimbursements as operating revenue. Under the SkyWest Airlines and ASA
Delta Connection Agreements, we are reimbursed for our engine overhaul expenses. We also record
those engine overhaul reimbursements as operating revenue. The following table summarizes the
41