SkyWest Airlines 2008 Annual Report Download - page 38
Download and view the complete annual report
Please find page 38 of the 2008 SkyWest Airlines annual report below. You can navigate through the pages in the report by either clicking on the pages listed below, or by using the keyword search tool below to find specific information within the annual report.-
 1
1 -
2
-
3
-
4
-
5
-
6
-
7
-
8
-
9
-
10
-
11
-
12
-
13
-
14
-
15
-
16
-
17
-
18
-
19
-
20
-
21
-
22
-
23
-
24
-
25
-
26
-
27
-
 28
28 -
 29
29 -
 30
30 -
 31
31 -
 32
32 -
 33
33 -
 34
34 -
 35
35 -
 36
36 -
 37
37 -
 38
38 -
 39
39 -
 40
40 -
 41
41 -
 42
42 -
 43
43 -
 44
44 -
 45
45 -
 46
46 -
 47
47 -
 48
48 -
49
-
50
-
51
-
52
-
53
-
54
-
55
-
56
-
57
-
58
-
59
-
60
-
61
-
62
-
63
-
64
-
65
-
66
-
67
-
68
-
69
-
70
-
71
-
72
-
73
-
74
-
75
-
76
-
77
-
78
-
79
-
80
-
81
-
82
-
83
-
84
-
85
-
86
-
87
-
88
-
89
-
90
-
91
-
92
-
93
-
94
-
95
-
96
-
97
-
98
-
99
-
100
-
101
-
102
-
103
-
104
-
105
-
106
-
107
-
108
-
109
-
110
-
111
-
112
-
113
-
114
-
115
-
116
-
117
-
118
-
119
-
120
-
121
-
122
-
123
-
124
-
125
-
126
-
127
-
128
-
129
-
130
-
131
-
132
-
133
-
134
-
135
-
136
-
137
-
138
-
139
-
140
-
141
-
142
-
143
-
144
-
145
-
146
-
147
-
148
-
149
-
150
-
151
-
152
 |
 |

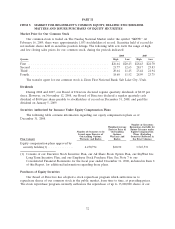
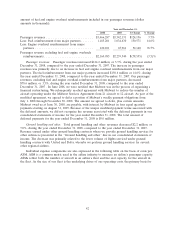
INDEXED RETURNS
Base Years Ending
Period
Company Name / Index Dec03 Dec04 Dec05 Dec06 Dec07 Dec08
SkyWest, Inc. ..................... 100 111.77 150.48 143.58 151.83 106.00
NASDAQ Composite ................ 100 108.41 110.79 122.16 134.29 79.25
Peer Group ....................... 100 95.56 107.77 160.08 140.12 86.81
The Peer Group consists of regional and major passenger airlines with U.S operations that have
equity securities traded on the Nasdaq Stock Market. The members of the Peer Group are: Air
France-KLM-ADR; Air T, Inc.; Air Transport Services Group; Allegiant Travel Co.; British
Airways PLC-ADR; Deutsche Lufthansa AG-ADR; Frontier Airlines Holdings; Great Lakes
Aviation Ltd.; Hawaiian Holdings, Inc.; Japan Airlines Corp-ADR; JetBlue Airways Corp.; Mesa Air
Group, Inc.; Pinnacle Airlines Corp.; Republic Airways Holdings Inc.; Ryanair Holdings PLC-ADR;
SkyWest, Inc.; and UAL Corp.
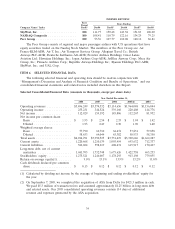
ITEM 6. SELECTED FINANCIAL DATA
The following selected financial and operating data should be read in conjunction with
‘‘Management’s Discussion and Analysis of Financial Condition and Results of Operations,’’ and our
consolidated financial statements and related notes included elsewhere in this Report.
Selected Consolidated Financial Data (amounts in thousands, except per share data):
Year Ended December 31,
2008 2007 2006 2005(2) 2004
Operating revenues .............. $3,496,249 $3,374,332 $3,114,656 $1,964,048 $1,156,044
Operating income ............... 255,231 344,524 339,160 220,408 144,776
Net income .................... 112,929 159,192 145,806 112,267 81,952
Net income per common share:
Basic ....................... $ 1.95 $ 2.54 $ 2.33 $ 1.94 $ 1.42
Diluted ..................... 1.93 2.49 2.30 1.90 1.40
Weighted average shares:
Basic ....................... 57,790 62,710 62,474 57,851 57,858
Diluted ..................... 58,633 64,044 63,382 58,933 58,350
Total assets .................... $4,014,291 $3,990,525 $3,731,419 $3,320,646 $1,662,287
Current assets .................. 1,220,668 1,210,139 1,095,454 693,632 712,337
Current liabilities ................ 386,604 398,219 408,431 615,917 170,467
Long-term debt, net of current
maturities ................... 1,681,705 1,732,748 1,675,626 1,422,758 463,233
Stockholders’ equity .............. 1,275,521 1,246,007 1,178,293 913,198 779,055
Return on average equity(1) ........ 9.0% 13.1% 13.9% 13.2% 11.0%
Cash dividends declared per common
share ....................... $ 0.13 $ 0.12 $ 0.12 $ 0.12 $ 0.12
(1) Calculated by dividing net income by the average of beginning and ending stockholders’ equity for
the year
(2) On September 7, 2005, we completed the acquisition of ASA from Delta for $421.3 million in cash.
We paid $5.3 million of transaction fees and assumed approximately $1.25 billion in long-term debt
and related assets. Our 2005 consolidated operating revenues contain 114 days of additional
revenue and expenses generated by the ASA acquisition.
34