SkyWest Airlines 2008 Annual Report Download - page 47
Download and view the complete annual report
Please find page 47 of the 2008 SkyWest Airlines annual report below. You can navigate through the pages in the report by either clicking on the pages listed below, or by using the keyword search tool below to find specific information within the annual report.-
 1
1 -
2
-
3
-
4
-
5
-
6
-
7
-
8
-
9
-
10
-
11
-
12
-
13
-
14
-
15
-
16
-
17
-
18
-
19
-
20
-
21
-
22
-
23
-
24
-
25
-
26
-
27
-
28
-
29
-
30
-
31
-
32
-
33
-
34
-
35
-
36
-
 37
37 -
 38
38 -
 39
39 -
 40
40 -
 41
41 -
 42
42 -
 43
43 -
 44
44 -
 45
45 -
 46
46 -
 47
47 -
 48
48 -
 49
49 -
 50
50 -
 51
51 -
 52
52 -
 53
53 -
 54
54 -
 55
55 -
 56
56 -
 57
57 -
58
-
59
-
60
-
61
-
62
-
63
-
64
-
65
-
66
-
67
-
68
-
69
-
70
-
71
-
72
-
73
-
74
-
75
-
76
-
77
-
78
-
79
-
80
-
81
-
82
-
83
-
84
-
85
-
86
-
87
-
88
-
89
-
90
-
91
-
92
-
93
-
94
-
95
-
96
-
97
-
98
-
99
-
100
-
101
-
102
-
103
-
104
-
105
-
106
-
107
-
108
-
109
-
110
-
111
-
112
-
113
-
114
-
115
-
116
-
117
-
118
-
119
-
120
-
121
-
122
-
123
-
124
-
125
-
126
-
127
-
128
-
129
-
130
-
131
-
132
-
133
-
134
-
135
-
136
-
137
-
138
-
139
-
140
-
141
-
142
-
143
-
144
-
145
-
146
-
147
-
148
-
149
-
150
-
151
-
152
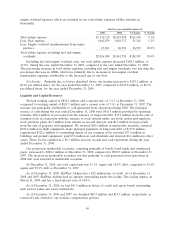
 |
 |

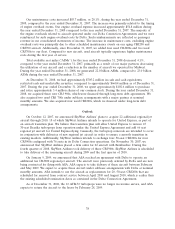
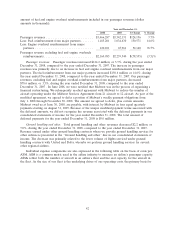
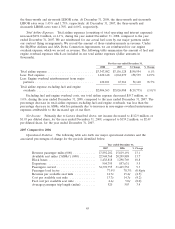
our presentation in this Item 7 is on a cost per ASM basis to discuss significant changes in our costs
not proportionate to the relative changes in our fleet size (dollar amounts in thousands).
Year ended December 31,
2008 2007
2008 2007 $ Change % Change Cents Per Cents Per
Amount Amount Amount Percent ASM ASM
Aircraft fuel ................ $1,220,618 $1,062,079 $158,539 14.9% 5.5 4.6
Salaries, wages and benefits ..... 724,094 726,947 (2,853) (0.4)% 3.3 3.2
Aircraft maintenance, materials
and repairs ............... 381,653 297,960 83,693 28.1% 1.7 1.3
Aircraft rentals .............. 295,784 294,443 1,341 0.5% 1.4 1.3
Depreciation and amortization . . . 220,195 208,944 11,251 5.4% 1.0 0.9
Station rentals and landing fees . . 132,017 135,757 (3,740) (2.8)% 0.6 0.6
Ground handling services ....... 106,135 140,374 (34,239) (24.4)% 0.5 0.6
Other ..................... 160,522 163,304 (2,782) (1.7)% 0.7 0.7
Total operating expenses ....... 3,241,018 3,029,808 211,210 7.0% 14.6 13.2
Interest .................... 106,064 126,320 (20,256) (16.0)% 0.5 0.5
Total airline expenses .......... $3,347,082 $3,156,128 190,954 6.1% 15.1 13.7
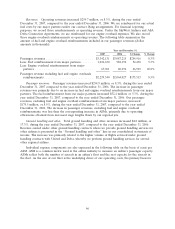
Fuel. Fuel costs increased $158.5 million, or 14.9% during the year ended December 31, 2008,
compared to the year ended December 31, 2007. The average cost per gallon of fuel increased to $3.33
per gallon during the year ended December 31, 2008 from $2.41 during the year ended December 31,
2007. The increase in the average cost per gallon during the year ended December 31, 2008 was
mitigated by United purchasing fuel directly from a fuel vendor for our United Express aircraft
operated out of Chicago, San Francisco, Los Angeles and Denver. Midwest also purchased all of its
fuel directly from fuel vendors, which reduced our total fuel costs and related passenger revenue. The
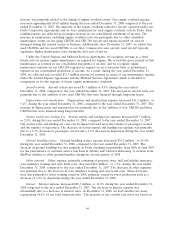
following table summarizes the gallons of fuel we purchased directly, and the change in fuel price per
gallon on our fuel expense:
For the year ended December 31,
(in thousands, except per gallon amounts) 2008 2007 % Change
Fuel gallons purchased ................... 366,540 440,044 (16.7)%
Average price per gallon .................. $ 3.33 $ 2.41 38.2%
Fuel expense .......................... $1,220,618 $1,062,079 14.9%
We are at risk for increased fuel prices on our pro-rate flying operations, whereby we receive a
pro-rated portion of the passenger fare as revenue. As of December 31, 2008, we operated a total of 32
Brasilia turboprops under separate pro-rate agreements with Delta and United. During the year ended
December 31, 2008, the cost of fuel associated with the pro-rate operations increased approximately
$6.5 million (pre-tax) compared to the year ended December 31, 2007.
Salaries Wages and Employee Benefits. Salaries, wages and employee benefits decreased
$2.9 million, or 0.4%, during the year ended December 31, 2008, compared to the year ended
December 31, 2007. The average number of full-time equivalent employees decreased 2.6% to 14,315
for the year ended December 31, 2008, from 14,694 for the year ended December 31, 2007. The
decrease in number of employees was significantly due to Delta assuming responsibility from ASA in
June 2007 for the performance of customer service functions in Atlanta and United transitioning 16
stations from SkyWest Airlines to other ground handlers during the second quarter of 2008.
Aircraft maintenance, materials and repairs. Maintenance costs increased $83.7 million, or 28.1%,
during the year ended December 31, 2008, compared to the year ended December 31, 2007. The
43