SkyWest Airlines 2008 Annual Report Download - page 39
Download and view the complete annual report
Please find page 39 of the 2008 SkyWest Airlines annual report below. You can navigate through the pages in the report by either clicking on the pages listed below, or by using the keyword search tool below to find specific information within the annual report.-
 1
1 -
2
-
3
-
4
-
5
-
6
-
7
-
8
-
9
-
10
-
11
-
12
-
13
-
14
-
15
-
16
-
17
-
18
-
19
-
20
-
21
-
22
-
23
-
24
-
25
-
26
-
27
-
28
-
 29
29 -
 30
30 -
 31
31 -
 32
32 -
 33
33 -
 34
34 -
 35
35 -
 36
36 -
 37
37 -
 38
38 -
 39
39 -
 40
40 -
 41
41 -
 42
42 -
 43
43 -
 44
44 -
 45
45 -
 46
46 -
 47
47 -
 48
48 -
 49
49 -
50
-
51
-
52
-
53
-
54
-
55
-
56
-
57
-
58
-
59
-
60
-
61
-
62
-
63
-
64
-
65
-
66
-
67
-
68
-
69
-
70
-
71
-
72
-
73
-
74
-
75
-
76
-
77
-
78
-
79
-
80
-
81
-
82
-
83
-
84
-
85
-
86
-
87
-
88
-
89
-
90
-
91
-
92
-
93
-
94
-
95
-
96
-
97
-
98
-
99
-
100
-
101
-
102
-
103
-
104
-
105
-
106
-
107
-
108
-
109
-
110
-
111
-
112
-
113
-
114
-
115
-
116
-
117
-
118
-
119
-
120
-
121
-
122
-
123
-
124
-
125
-
126
-
127
-
128
-
129
-
130
-
131
-
132
-
133
-
134
-
135
-
136
-
137
-
138
-
139
-
140
-
141
-
142
-
143
-
144
-
145
-
146
-
147
-
148
-
149
-
150
-
151
-
152
 |
 |

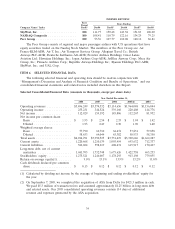
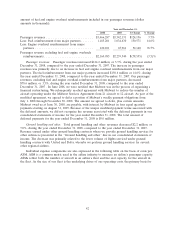
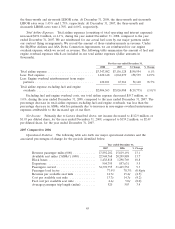
Selected Operating Data
Year Ended December 31,
2008 2007 2006 2005 2004
Block hours .................... 1,376,815 1,438,818 1,298,769 866,975 589,129
Departures .................... 872,288 904,795 857,631 623,307 464,697
Passengers carried ............... 33,461,819 34,392,755 31,465,552 20,343,975 13,424,520
Revenue passenger miles (000) ...... 17,101,910 17,892,282 15,819,191 9,538,906 5,546,069
Available seat miles (000) ......... 22,020,250 22,968,768 20,209,888 12,718,973 7,546,318
Revenue per available seat mile ..... 15.9¢ 14.7¢ 15.4¢ 15.4¢ 15.3¢
Cost per available seat mile ........ 15.2¢ 13.7¢ 14.3¢ 14.1¢ 13.6¢
Average passenger trip length ....... 511 520 503 469 413
Number of operating aircraft at end of
year ........................ 442 436 410 380 206
The following terms used in this section and elsewhere in this Report have the meanings indicated
below:
‘‘Revenue passenger miles’’ represents the number of miles flown by revenue passengers.
‘‘Available seat miles’’ represents the number of seats available for passengers multiplied by the
number of miles the seats are flown.
‘‘Revenue per available seat mile’’ represents passenger revenue divided by available seat miles.
‘‘Cost per available seat mile’’ represents operating expenses plus interest divided by available seat
miles.
35