SkyWest Airlines 2008 Annual Report Download - page 53
Download and view the complete annual report
Please find page 53 of the 2008 SkyWest Airlines annual report below. You can navigate through the pages in the report by either clicking on the pages listed below, or by using the keyword search tool below to find specific information within the annual report.-
 1
1 -
2
-
3
-
4
-
5
-
6
-
7
-
8
-
9
-
10
-
11
-
12
-
13
-
14
-
15
-
16
-
17
-
18
-
19
-
20
-
21
-
22
-
23
-
24
-
25
-
26
-
27
-
28
-
29
-
30
-
31
-
32
-
33
-
34
-
35
-
36
-
37
-
38
-
39
-
40
-
41
-
42
-
 43
43 -
 44
44 -
 45
45 -
 46
46 -
 47
47 -
 48
48 -
 49
49 -
 50
50 -
 51
51 -
 52
52 -
 53
53 -
 54
54 -
 55
55 -
 56
56 -
 57
57 -
 58
58 -
 59
59 -
 60
60 -
 61
61 -
 62
62 -
 63
63 -
64
-
65
-
66
-
67
-
68
-
69
-
70
-
71
-
72
-
73
-
74
-
75
-
76
-
77
-
78
-
79
-
80
-
81
-
82
-
83
-
84
-
85
-
86
-
87
-
88
-
89
-
90
-
91
-
92
-
93
-
94
-
95
-
96
-
97
-
98
-
99
-
100
-
101
-
102
-
103
-
104
-
105
-
106
-
107
-
108
-
109
-
110
-
111
-
112
-
113
-
114
-
115
-
116
-
117
-
118
-
119
-
120
-
121
-
122
-
123
-
124
-
125
-
126
-
127
-
128
-
129
-
130
-
131
-
132
-
133
-
134
-
135
-
136
-
137
-
138
-
139
-
140
-
141
-
142
-
143
-
144
-
145
-
146
-
147
-
148
-
149
-
150
-
151
-
152
 |
 |

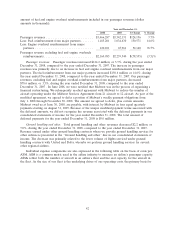
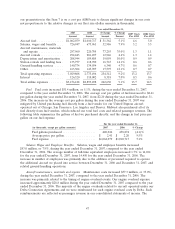
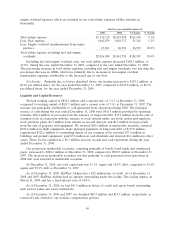
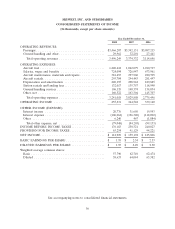
engine overhaul expenses which are included in our total airline expenses (dollar amounts in
thousands).
For the year ended December 31,
2007 2006 $ Change % Change
Total airline expense .......................... $3,156,128 $2,893,498 $262,630 9.1%
Less: Fuel expense ........................... 1,062,079 1,010,717 51,362 5.1%
Less: Engine overhaul reimbursement from major
partners ................................. 67,961 40,996 26,965 65.8%
Total airline expense excluding fuel and engine
overhauls ................................ $2,026,088 $1,841,785 $184,303 10.0%
Excluding fuel and engine overhaul costs, our total airline expense increased $184.3 million, or
10.0%, during the year ended December 31, 2007, compared to the year ended December 31, 2006.
The percentage increase in total airline expenses excluding fuel and engine overhauls, was less than the
percentage decrease in ASMs, which was primarily due to increases in non-engine overhaul
maintenance expenses attributable to the increased age of our fleet.
Net Income. Primarily due to factors described above, net income increased to $159.2 million, or
$2.49 per diluted share, for the year ended December 31, 2007, compared to $145.8 million, or $2.30
per diluted share, for the year ended December 31, 2006.
Liquidity and Capital Resources
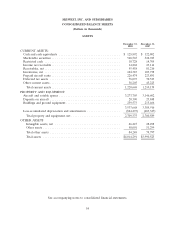
We had working capital of $834.1 million and a current ratio of 3.2:1 at December 31, 2008,
compared to working capital of $811.9 million and a current ratio of 3.0:1 at December 31, 2007. The
increase was principally attributable to cash generated from operations during 2008. The principal
sources of cash during the year ended December 31, 2008 were $415.5 million provided by operating
activities, $80.4 million of proceeds from the issuance of long-term debt, $17.4 million from the sale of
common stock in connection with the exercise of stock options under our stock option and employee
stock purchase plans, $3.5 million from returns on aircraft deposits and $4.6 million from proceeds
from the sale of property and equipment. We invested $50.4 million in marketable securities, invested
$194.2 million in flight equipment, made principal payments on long-term debt of $119.8 million,
repurchased $102.6 million of outstanding shares of our common stock, invested $37.6 million in
buildings and ground equipment, paid $7.0 million in cash dividends and invested $6.6 million in other
assets. These factors resulted in a $3.1 million increase in cash and cash equivalents during the year
ended December 31, 2008.
Our position in marketable securities, consisting primarily of bonds, bond funds and commercial
paper, increased to $568.6 million at December 31, 2008, compared to $522.9 million at December 31,
2007. The increase in marketable securities was due primarily to cash generated from operations in
2008 that were invested in marketable securities.
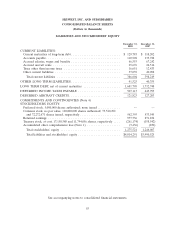
At December 31, 2008, our total capital mix was 43.1% equity and 56.9% debt, compared to 41.8%
equity and 58.2% debt at December 31, 2007.
As of December 31, 2008, SkyWest Airlines has a $25 million line of credit. As of December 31,
2008 and 2007, SkyWest Airlines had no amount outstanding under the facility. The facility expires on
March 31, 2009 and has a fixed interest rate of 4.01%.
As of December 31, 2008, we had $41.9 million in letters of credit and surety bonds outstanding
with various banks and surety institutions.
As of December 31, 2008 and 2007, we classified $10.7 million and $14.7 million, respectively, as
restricted cash, related to our workers compensation policies.
49