SkyWest Airlines 2008 Annual Report Download - page 50
Download and view the complete annual report
Please find page 50 of the 2008 SkyWest Airlines annual report below. You can navigate through the pages in the report by either clicking on the pages listed below, or by using the keyword search tool below to find specific information within the annual report.-
 1
1 -
2
-
3
-
4
-
5
-
6
-
7
-
8
-
9
-
10
-
11
-
12
-
13
-
14
-
15
-
16
-
17
-
18
-
19
-
20
-
21
-
22
-
23
-
24
-
25
-
26
-
27
-
28
-
29
-
30
-
31
-
32
-
33
-
34
-
35
-
36
-
37
-
38
-
39
-
 40
40 -
 41
41 -
 42
42 -
 43
43 -
 44
44 -
 45
45 -
 46
46 -
 47
47 -
 48
48 -
 49
49 -
 50
50 -
 51
51 -
 52
52 -
 53
53 -
 54
54 -
 55
55 -
 56
56 -
 57
57 -
 58
58 -
 59
59 -
 60
60 -
61
-
62
-
63
-
64
-
65
-
66
-
67
-
68
-
69
-
70
-
71
-
72
-
73
-
74
-
75
-
76
-
77
-
78
-
79
-
80
-
81
-
82
-
83
-
84
-
85
-
86
-
87
-
88
-
89
-
90
-
91
-
92
-
93
-
94
-
95
-
96
-
97
-
98
-
99
-
100
-
101
-
102
-
103
-
104
-
105
-
106
-
107
-
108
-
109
-
110
-
111
-
112
-
113
-
114
-
115
-
116
-
117
-
118
-
119
-
120
-
121
-
122
-
123
-
124
-
125
-
126
-
127
-
128
-
129
-
130
-
131
-
132
-
133
-
134
-
135
-
136
-
137
-
138
-
139
-
140
-
141
-
142
-
143
-
144
-
145
-
146
-
147
-
148
-
149
-
150
-
151
-
152
 |
 |

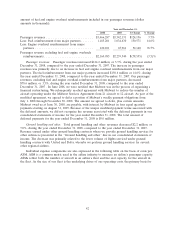
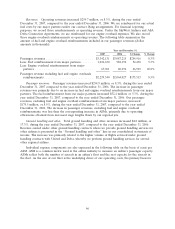
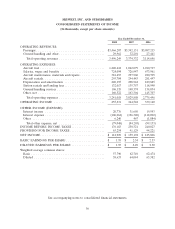
Revenues. Operating revenues increased $259.7 million, or 8.3%, during the year ended
December 31, 2007, compared to the year ended December 31, 2006. We are reimbursed for our actual
fuel costs by our major partners under our contract flying arrangements. For financial reporting
purposes, we record those reimbursements as operating revenue. Under the SkyWest Airlines and ASA
Delta Connection Agreements, we are reimbursed for our engine overhaul expenses. We also record
those engine overhaul reimbursements as operating revenue. The following table summarizes the
amount of fuel and engine overhaul reimbursements included in our passenger revenues (dollar
amounts in thousands).
Year end December 31,
2007 2006 $ Change % Change
Passenger revenues ........................... $3,342,131 $3,087,215 $254,916 8.3%
Less: Fuel reimbursement from major partners ....... 1,034,630 982,192 52,438 5.3%
Less: Engine overhaul reimbursement from major
partners ................................. 67,961 40,996 26,965 65.8%
Passenger revenue excluding fuel and engine overhauls
reimbursements ............................ $2,239,540 $2,064,027 $175,513 8.5%
Passenger revenues. Passenger revenues increased $254.9 million, or 8.3%, during the year ended
December 31, 2007 compared to the year ended December 31, 2006. The increase in passenger
revenues was primarily due to an increase in fuel and engine overhaul reimbursements from our major
partners. The fuel reimbursement from our major partners increased $52.4 million, or 5.3%, during the
year ended December 31, 2007, compared to the year ended December 31, 2006. Our passenger
revenues, excluding fuel and engine overhaul reimbursements from major partners, increased
$175.5 million, or 8.5%, during the year ended December 31, 2007, compared to the year ended
December 31, 2006. The increase in passenger revenues, excluding fuel and engine overhaul
reimbursements, was less than the corresponding increase in ASMs, primarily due to operating
efficiencies obtained from increased stage lengths flown by our regional jets.
Ground handling and other. Total ground handling and other revenues increased $4.8 million, or
17.3%, during the year ended December 31, 2007, compared to the year ended December 31, 2006.
Revenue earned under other ground handling contracts where we provide ground handling services for
other airlines is presented in the ‘‘Ground handling and other’’ line in our consolidated statements of
income. The increase was primarily related to the higher volume of flights serviced under ground
handling contracts with United and Delta, whereby we perform ground handling services for several
other regional airlines.
Individual expense components are also expressed in the following table on the basis of cents per
ASM. ASM is a common metric used in the airline industry to measure an airline’s passenger capacity.
ASMs reflect both the number of aircraft in an airline’s fleet and the seat capacity for the aircraft in
the fleet. As the size of our fleet is the underlying driver of our operating costs, the primary basis for
46