SkyWest Airlines 2008 Annual Report Download - page 49
Download and view the complete annual report
Please find page 49 of the 2008 SkyWest Airlines annual report below. You can navigate through the pages in the report by either clicking on the pages listed below, or by using the keyword search tool below to find specific information within the annual report.-
 1
1 -
2
-
3
-
4
-
5
-
6
-
7
-
8
-
9
-
10
-
11
-
12
-
13
-
14
-
15
-
16
-
17
-
18
-
19
-
20
-
21
-
22
-
23
-
24
-
25
-
26
-
27
-
28
-
29
-
30
-
31
-
32
-
33
-
34
-
35
-
36
-
37
-
38
-
 39
39 -
 40
40 -
 41
41 -
 42
42 -
 43
43 -
 44
44 -
 45
45 -
 46
46 -
 47
47 -
 48
48 -
 49
49 -
 50
50 -
 51
51 -
 52
52 -
 53
53 -
 54
54 -
 55
55 -
 56
56 -
 57
57 -
 58
58 -
 59
59 -
60
-
61
-
62
-
63
-
64
-
65
-
66
-
67
-
68
-
69
-
70
-
71
-
72
-
73
-
74
-
75
-
76
-
77
-
78
-
79
-
80
-
81
-
82
-
83
-
84
-
85
-
86
-
87
-
88
-
89
-
90
-
91
-
92
-
93
-
94
-
95
-
96
-
97
-
98
-
99
-
100
-
101
-
102
-
103
-
104
-
105
-
106
-
107
-
108
-
109
-
110
-
111
-
112
-
113
-
114
-
115
-
116
-
117
-
118
-
119
-
120
-
121
-
122
-
123
-
124
-
125
-
126
-
127
-
128
-
129
-
130
-
131
-
132
-
133
-
134
-
135
-
136
-
137
-
138
-
139
-
140
-
141
-
142
-
143
-
144
-
145
-
146
-
147
-
148
-
149
-
150
-
151
-
152
 |
 |

the three-month and six-month LIBOR rates. At December 31, 2008, the three-month and six-month
LIBOR rates were 1.43% and 1.75%, respectively. At December 31, 2007, the three-month and
six-month LIBOR rates were 4.70% and 4.60%, respectively.
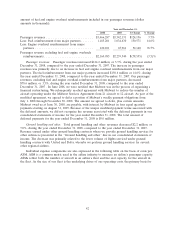
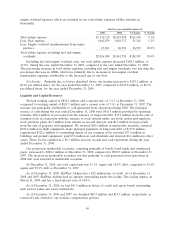
Total Airline Expenses. Total airline expenses (consisting of total operating and interest expenses)
increased $191.0 million, or 6.1%, during the year ended December 31, 2008, compared to the year
ended December 31, 2007. We are reimbursed for our actual fuel costs by our major partners under
our contract flying arrangements. We record the amount of those reimbursements as revenue. Under
the SkyWest Airlines and ASA Delta Connection Agreements, we are reimbursed for our engine
overhaul expense, which we record as revenue. The following table summarizes the amount of fuel and
engine overhaul expenses which are included in our total airline expenses (dollar amounts in
thousands).
For the year ended December 31,
2008 2007 $ Change % Change
Total airline expense .......................... $3,347,082 $3,156,128 $190,954 6.1%
Less: Fuel expense ........................... 1,220,618 1,062,079 158,539 14.9%
Less: Engine overhaul reimbursement from major
partners ................................. 120,101 67,961 52,140 76.7%
Total airline expense excluding fuel and engine
overhauls ................................ $2,006,363 $2,026,088 $(19,735) (1.0)%
Excluding fuel and engine overhaul costs, our total airline expense decreased $19.7 million, or
1.0%, during the year ended December 31, 2008, compared to the year ended December 31, 2007. The
percentage decrease in total airline expenses excluding fuel and engine overhauls, was less than the
percentage decrease in ASMs, which is primarily due to increases in non-engine overhaul maintenance
expenses attributable to the increased age of our fleet.
Net Income. Primarily due to factors described above, net income decreased to $112.9 million, or
$1.93 per diluted share, for the year ended December 31, 2008, compared to $159.2 million, or $2.49
per diluted share, for the year ended December 31, 2007.
2007 Compared to 2006
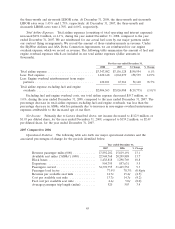
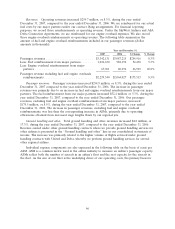
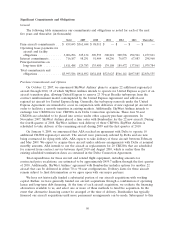
Operational Statistics. The following table sets forth our major operational statistics and the
associated percentages-of-change for the periods identified below.
Year ended December 31,
2007 2006 % Change
Revenue passenger miles (000) ............. 17,892,282 15,819,191 13.1
Available seat miles (‘‘ASMs’’) (000) ......... 22,968,768 20,209,888 13.7
Block hours ........................... 1,438,818 1,298,769 10.8
Departures ........................... 904,795 857,631 5.5
Passengers carried ...................... 34,392,755 31,465,552 9.3
Passenger load factor .................... 77.9% 78.3% (0.4)pts
Revenue per available seat mile ............ 14.7¢ 15.4¢ (4.5)
Cost per available seat mile ............... 13.7¢ 14.3¢ (4.2)
Fuel cost per available seat mile ............ 4.6¢ 5.0¢ (8.0)
Average passenger trip length (miles) ........ 520 503 3.4
45