SkyWest Airlines 2008 Annual Report Download - page 51
Download and view the complete annual report
Please find page 51 of the 2008 SkyWest Airlines annual report below. You can navigate through the pages in the report by either clicking on the pages listed below, or by using the keyword search tool below to find specific information within the annual report.-
 1
1 -
2
-
3
-
4
-
5
-
6
-
7
-
8
-
9
-
10
-
11
-
12
-
13
-
14
-
15
-
16
-
17
-
18
-
19
-
20
-
21
-
22
-
23
-
24
-
25
-
26
-
27
-
28
-
29
-
30
-
31
-
32
-
33
-
34
-
35
-
36
-
37
-
38
-
39
-
40
-
 41
41 -
 42
42 -
 43
43 -
 44
44 -
 45
45 -
 46
46 -
 47
47 -
 48
48 -
 49
49 -
 50
50 -
 51
51 -
 52
52 -
 53
53 -
 54
54 -
 55
55 -
 56
56 -
 57
57 -
 58
58 -
 59
59 -
 60
60 -
 61
61 -
62
-
63
-
64
-
65
-
66
-
67
-
68
-
69
-
70
-
71
-
72
-
73
-
74
-
75
-
76
-
77
-
78
-
79
-
80
-
81
-
82
-
83
-
84
-
85
-
86
-
87
-
88
-
89
-
90
-
91
-
92
-
93
-
94
-
95
-
96
-
97
-
98
-
99
-
100
-
101
-
102
-
103
-
104
-
105
-
106
-
107
-
108
-
109
-
110
-
111
-
112
-
113
-
114
-
115
-
116
-
117
-
118
-
119
-
120
-
121
-
122
-
123
-
124
-
125
-
126
-
127
-
128
-
129
-
130
-
131
-
132
-
133
-
134
-
135
-
136
-
137
-
138
-
139
-
140
-
141
-
142
-
143
-
144
-
145
-
146
-
147
-
148
-
149
-
150
-
151
-
152
 |
 |

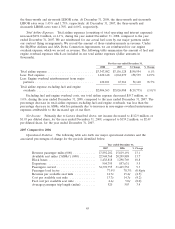
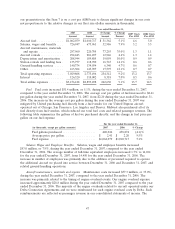
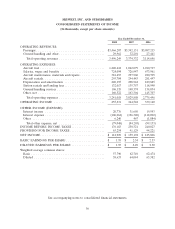
our presentation in this Item 7 is on a cost per ASM basis to discuss significant changes in our costs
not proportionate to the relative changes in our fleet size (dollar amounts in thousands).
Year ended December 31,
2007 2006 $ Change % Change 2007 Cents 2006 Cents
Amount Amount Amount Percent Per ASM Per ASM
Aircraft fuel ............... $1,062,079 $1,010,717 $ 51,362 5.1% 4.6 5.0
Salaries, wages and benefits .... 726,947 673,961 52,986 7.9% 3.2 3.3
Aircraft maintenance, materials
and repairs .............. 297,960 220,705 77,255 35.0% 1.3 1.1
Aircraft rentals ............. 294,443 281,497 12,946 4.6% 1.3 1.4
Depreciation and amortization . 208,944 189,885 19,059 10.0% 0.9 0.9
Station rentals and landing fees . 135,757 118,990 16,767 14.1% 0.6 0.6
Ground handling services ..... 140,374 134,034 6,340 4.7% 0.6 0.7
Other .................... 163,304 145,707 17,597 12.1% 0.7 0.7
Total operating expenses ...... 3,029,808 2,775,496 254,312 9.2% 13.2 13.7
Interest .................. 126,320 118,002 8,318 7.0% 0.5 0.6
Total airline expenses ........ $3,156,128 $2,893,498 262,630 9.1% 13.7 14.3
Fuel. Fuel costs increased $51.4 million, or 5.1%, during the year ended December 31, 2007,
compared to the year ended December 31, 2006. The average cost per gallon of fuel increased to $2.41
per gallon during the year ended December 31, 2007, from $2.20 during the year ended December 31,
2006. The increase in the average cost per gallon during the year ended December 31, 2007 was
mitigated by United purchasing fuel directly from a fuel vendor for our United Express aircraft
operated out of Chicago, San Francisco, Los Angeles and Denver. Midwest also purchased all of its
fuel directly from fuel vendors, which reduced our total fuel costs and related passenger revenue. The
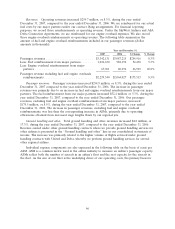
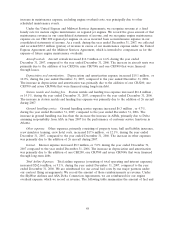
following table summarizes the gallons of fuel we purchased directly, and the change in fuel price per
gallon on our fuel expense:
For the year ended December 31,
(in thousands, except per gallon amounts) 2007 2006 % Change
Fuel gallons purchased ................... 440,044 458,874 (4.1)%
Average price per gallon .................. $ 2.41 $ 2.20 9.5%
Fuel expense .......................... $1,062,079 $1,010,717 5.1%
Salaries Wages and Employee Benefits. Salaries, wages and employee benefits increased
$53.0 million, or 7.9%, during the year ended December 31, 2007, compared to the year ended
December 31, 2006. The average number of full-time equivalent employees increased 1.7% to 14,694
for the year ended December 31, 2007, from 14,450 for the year ended December 31, 2006. The
increase in number of employees was primarily due to the addition of personnel required to operate
the additional aircraft we placed into service between December 31, 2006 and December 31, 2007, and
related ground handling operations.
Aircraft maintenance, materials and repairs. Maintenance costs increased $77.3 million, or 35.0%,
during the year ended December 31, 2007, compared to the year ended December 31, 2006. The
increase was primarily related to the timing of engine overhaul events. Our engine overhaul expense
increased approximately $28.8 million during the year ended December 31, 2007 compared to the year
ended December 31, 2006. The majority of the engine overhauls related to aircraft operated under our
Delta Connection Agreements and we were reimbursed for such engine overhaul costs by Delta. Such
reimbursements are reflected as passenger revenue in our consolidated statements of income. The
47