Samsung 2011 Annual Report Download - page 47
Download and view the complete annual report
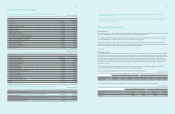
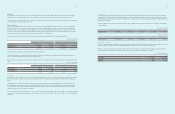
Please find page 47 of the 2011 Samsung annual report below. You can navigate through the pages in the report by either clicking on the pages listed below, or by using the keyword search tool below to find specific information within the annual report.-
 1
1 -
2
-
3
-
4
-
5
-
6
-
7
-
8
-
9
-
10
-
11
-
12
-
13
-
14
-
15
-
16
-
17
-
18
-
19
-
20
-
21
-
22
-
23
-
24
-
25
-
26
-
27
-
28
-
29
-
30
-
31
-
32
-
33
-
34
-
35
-
36
-
 37
37 -
 38
38 -
 39
39 -
 40
40 -
 41
41 -
 42
42 -
 43
43 -
 44
44 -
 45
45 -
 46
46 -
 47
47 -
 48
48 -
 49
49 -
 50
50 -
 51
51 -
 52
52
 |
 |

88
89
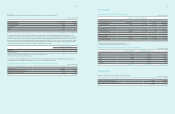
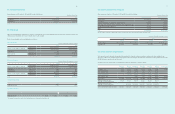
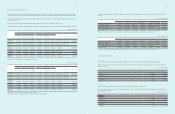
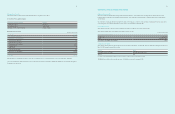
31. Segment Information
The chief operating decision maker has been identified as the Management Committee. The Management Committee is responsible for making strategic
decisions based on review of the group’s internal reporting. The management committee has determined the operating segments based on these reports.
The Management Committee reviews operating profit of each operating segment in order to assess performance and make decisions about resources to be
allocated to the segment.
The operating segments are product based and include Digital media, Telecommunication, Semiconductor, LCD and others.
The segment information provided to the Management committee for the reportable segments for the year ended 31 December 2011 and 2010, is as follows :
(In millions of Korean Won)
2011
SET Device
Total¹Elimination Consolidated
Total¹Digital Media
Tele-
Communi-
cation
Total¹Semi
conductor LCD
Total segment
Revenue 246,168,779 132,067,414 113,263,888 131,926,525 71,305,465 61,648,667 378,693,504 (213,691,733) 165,001,771
Inter-segment
Revenue (131,313,977) (73,145,237) (57,729,846) (66,373,586) (34,315,914) (32,405,595) (213,691,733) 213,691,733 -
Revenue from
external
customers
114,854,802 58,922,177 55,534,042 65,552,939 36,989,551 29,243,072 165,001,771 - 165,001,771
Depreciation (1,138,951) (644,759) (296,138) (11,715,044) (7,678,022) (4,027,032) (12,934,274) - (12,934,274)
Amortization (192,114) (18,862) (149,325) (204,109) (143,810) (61,943) (657,790) - (657,790)
Operating
profit (loss) 9,706,360 1,412,949 8,269,798 6,588,438 7,33 9,2 06 (749,339) 16,249,717 - 16,249,717
¹ The total amount includes others not composing operating segments.
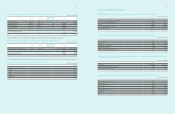
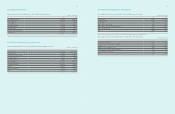
(In millions of Korean Won)
2010
SET Device
Total¹Elimination Consolidated
Total¹Digital Media
Tele-
Communi-
cation
Total¹Semi
conductor LCD
Total segment
Revenue 214,945,026 135,652,814 78,293,262 134,384,718 72,806,264 62,162,133 362,098,684
(207,468,356) 154,630,328
Inter-segment
Revenue (115,898,073) (77,265,652) (38,223,312) (67,546,082) (35,167,480) (32,242,249) (207,468,356) 207,468,356 -
Revenue from
external
customers
99,046,953 58,3 87,162 40,069,950 66,838,636 37,638,784 29,919,884 154,630,328 - 154,630,328
Depreciation (984,124) (524,897) (285,391) (9,809,152) (6,335,282) (3,472,011) (10,847,374) - (10,847,374)
Amortization (175,329) (19,179) (131,467) (176,894) (136,075) (40,993) (546,522) - (546,522)
Operating
profit (loss) 4,822,401 429,482 4,359,254 12,089,126 10,110,698 1,991,990 17,296,536 - 17, 29 6, 5 36
¹ The total amount includes others not composing operating segments.
* SET segment has been re-categorized considering changes in organization during current year.
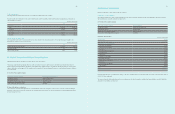
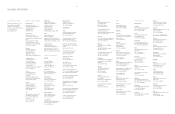
The regional segment information provided to the Management committee for the reportable segments for the year ended 31 December 2011 and 2010, is
as follows :
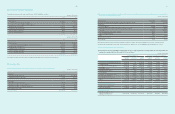
(In millions of Korean Won)
2011
Korea America Europe Asia and Africa China Eliminations Consolidated
Total segment - Revenue 143,717,714 67,967,462 63,096,978 41,853,227 62,058,123 (213,691,733) 165,001,771
Inter-segment - Revenue (117,185,100) (20,441,236) (24,028,163) (13,035,182) (39,002,052) 213,691,733 -
Revenue from external customers 26,532,614 47,526,226 39,068,815 28,818,045 23,056,071 - 165,001,771
Non-current assets¹ 53,864,391 7,157,372 943,800 1,333,012 2,229,989 (129,377) 65,399,187
¹ The total of non-current assets other than financial instruments, deferred tax assets, associated companies and investments in joint-ventures.
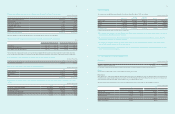
(In millions of Korean Won)
2010
Korea America Europe Asia and Africa China Eliminations Consolidated
Total segment - Revenue 137,732,753 63,898,852 64,245,381 33,988,191 62,233,507 (207,468,356) 154,630,328
Inter-segment - Revenue (111,880,989) (20,378,256) (28,115,494) (9,134,491) (37,959,126) 207,468,356 -
Revenue from external customers 25,851,764 43,520,596 36,129,887 24,853,700 24,274,381 - 154,630,328
Non-current assets¹ 47,622,520 4,926,910 971,032 1,062,261 1,625,001 (463,691) 55,744,033
¹ The total of non-current assets other than financial instruments, deferred tax assets, associated companies and investments in joint-ventures.
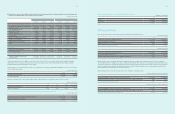
32. Related Parties
A) Associates
The principal associate companies are Samsung SDI, Samsung Electro-mechanics, Samsung SDS, Samsung Techwin and Samsung Card.
Transactions with associates for the years ended December 31, 2011 and 2010, and the related receivables and payables as of December 31, 2011 and
2010, are as follows :
(In millions of Korean Won)
2011 2010
Transactions
Sales ₩ 1,695,298 ₩1,503,642
Purchases 8,634,597 7,262,621
Receivables and Payables
Receivables 225,076 183,812
Payables 1,168,952 816,473
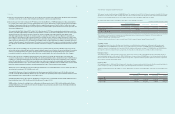
B) Joint ventures
The principal joint venture copanies are Samsung Corning Precision Materials, and Samsung Siltronic Wafer.
Transactions with joint venture partners for the years ended December 31, 2011 and 2010, and the related receivables and payables as of December 31,
2011 and 2010, are as follows :
(In millions of Korean Won)
2011 2010
Transactions
Sales ₩ 7,195 ₩ 12,690
Purchases 3,210,831 3,212,732
Receivables and Payables
Receivables 6,379 131
Payables 379,944 126,906