Samsung 2011 Annual Report Download - page 46
Download and view the complete annual report
Please find page 46 of the 2011 Samsung annual report below. You can navigate through the pages in the report by either clicking on the pages listed below, or by using the keyword search tool below to find specific information within the annual report.-
 1
1 -
2
-
3
-
4
-
5
-
6
-
7
-
8
-
9
-
10
-
11
-
12
-
13
-
14
-
15
-
16
-
17
-
18
-
19
-
20
-
21
-
22
-
23
-
24
-
25
-
26
-
27
-
28
-
29
-
30
-
31
-
32
-
33
-
34
-
35
-
 36
36 -
 37
37 -
 38
38 -
 39
39 -
 40
40 -
 41
41 -
 42
42 -
 43
43 -
 44
44 -
 45
45 -
 46
46 -
 47
47 -
 48
48 -
 49
49 -
 50
50 -
 51
51 -
 52
52
 |
 |

86
87
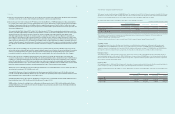
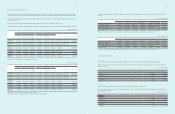
(2) Price risk
The Company’s investment portfolio consists of direct and indirect investments in listed and non-listed securities. The market values for the Company’s
equity investments for the year-ended December 31, 2011 and 2010 are ₩ 3,149,926 million and ₩ 2,990,441 million respectively. Refer to Note 7.
If there is change in price of equity investment by 1%, the amount of other comprehensive income changes for the year-ended December 31, 2011 and 2010
are ₩ 25,262 million and ₩ 26,641 million, respectively.
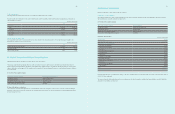
(3) Interest rate risk
Interest rate risk is defined as the risk that the fair value or future cash flows of a financial instrument will fluctuate because of changes in market interest
rates. The Company is exposed to interest rate risk mainly arising through interest bearing liabilities and assets. The Company’s position with regard to
interest rate risk exposure is mainly driven by its debt obligations such as bonds, interest-bearing deposits and issuance of receivables. In order to avoid
interest rate risk, the Company maintains minimum external borrowing by facilitating cash pooling systems on a regional and global basis. The Company
manages exposed interest rate risk via periodic monitoring and handles risk factors on a timely basis.
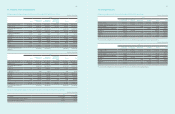
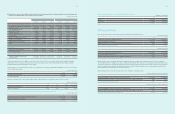
As at the reporting date, the interest rate profile of the Company’s interest bearing assets and liabilities is presented in the table below :
(In millions of Korean Won)
2011 2010
Fixed rate Floating rate Fixed rate Floating rate
Financial assets ₩ 53,626,861 ₩ 2,838,767 ₩ 48,532,894 ₩ -
Financial liabilities 41,129,584 880,702 30,742,720 4,969,320
₩ 12 ,497,277 ₩ 1,958,065 ₩ 17,790,174 ₩ (4,969,320)
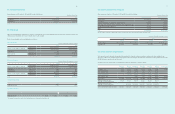
The sensitivity risk of the Company is determined based the following assumptions :
- When financial instruments are evaluated changes to profit and net equity as a result of changes in market interest rates which impact interest income
(expense) to financial instruments are evaluated using floating interest rates
Based on the above assumption, changes to profit and net equity as a result of 1% increases in interest rate on borrowings in foreign currency are presented
below.
(In millions of Korean Won)
2011 2010
Increase Decrease Increase Decrease
Financial assets ₩ 28,388 ₩ (28,388) ₩ - ₩ -
Financial liabilities (8,807) 8,807 (49,693) 49,693
₩ 19,581 ₩ (19,581) ₩ (49,693) ₩ 49,693
B) Credit risk
Credit risk arises during the normal course of transactions and investing activities, where clients or other party fails to discharge an obligation. The Company
monitors and sets the counterparty’s credit limit on a periodic basis based on the counterparty’s financial conditions, default history and other important
factors.
Credit risk arises from cash and cash equivalents, savings and derivative instruments transactions with financial institutions. To minimize such risk, the
Company transacts only with banks which have strong international credit rating (S&P A above), and all new transactions with financial institutions with
no prior transaction history are approved, managed and monitored by the Company’s finance team and the local financial center. The Company requires
separate approval procedure for contracts with restrictions.
The top five customers account for approximately occupies 12.9% and 14.3% and ₩ 2,831,801 million and ₩ 2,734,014 million for the year ended 2011 and
2010, respectively, while the top three credit exposures by country amounted to 16.0%, 14.7% and 10.4% (December 31, 2010 : 15.6%, 12.0% and 11.0%),
respectively.
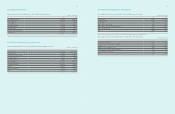
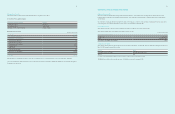
C) Liquidity risk
The Company manages its liquidity risk to maintain adequate net working capital by constantly managing projected cash flows. Beyond effective working
capital and cash management, the Company mitigates liquidity risk by contracting with financial institutions with respect to bank overdrafts, Cash Pooling
or Banking Facility agreement for efficient management of funds. Cash Pooling program allows sharing of funds among subsidiaries to minimize liquidity risk
and reduce financial expense.
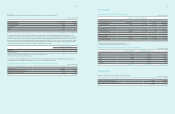
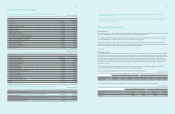
The following table below is an undiscounted cash flow analysis for financial liabilities that are presented on the balance sheet according to their remaining
contractual maturity.
(In millions of Korean Won)
Less than 3 months 4-6 months 7-12 months 1-5 years More than 5 years
Financial liabilities ₩ 31,045,236 ₩ 1,134,966 ₩ 3,951,111 ₩ 6,467,585 ₩ 92,737
(In millions of Korean Won)
Less than 3 months 4-6 months 7-12 months 1-5 years More than 5 years
Financial liabilities ₩ 30,303,459 ₩ 245,863 ₩ 2,409,404 ₩ 2,923,122 ₩ 103,832
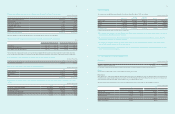
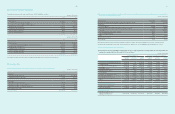
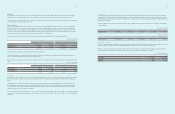
D) Capital risk management
The object of capital management is to maintain sound capital structure. Consistent with others in the industry, the Company monitors capital on the basis of
the debt to equity ratio. This ratio is calculated as total liabilities divided by equity based on the consolidated financial statements.
During 2011, the Company’s strategy was to maintain a reliable credit rating. The Company has maintained an A credit rating for long term debt from S&P
and A1 from Moody’s, respectively throughout the period. The gearing ratios at 31 December 2011 and 2010 were as follows :
(In millions of Korean Won)
2011 2010
Total liabilities ₩ 53,785,931 ₩ 44,939,653
Total equity 101,845,323 89,349,091
Gearing ratio 52.8% 50.3%