Samsung 2011 Annual Report Download - page 32
Download and view the complete annual report
Please find page 32 of the 2011 Samsung annual report below. You can navigate through the pages in the report by either clicking on the pages listed below, or by using the keyword search tool below to find specific information within the annual report.-
 1
1 -
2
-
3
-
4
-
5
-
6
-
7
-
8
-
9
-
10
-
11
-
12
-
13
-
14
-
15
-
16
-
17
-
18
-
19
-
20
-
21
-
 22
22 -
 23
23 -
 24
24 -
 25
25 -
 26
26 -
 27
27 -
 28
28 -
 29
29 -
 30
30 -
 31
31 -
 32
32 -
 33
33 -
 34
34 -
 35
35 -
 36
36 -
 37
37 -
 38
38 -
 39
39 -
 40
40 -
 41
41 -
 42
42 -
43
-
44
-
45
-
46
-
47
-
48
-
49
-
50
-
51
-
52
 |
 |
58
59
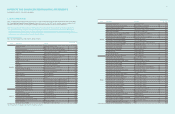
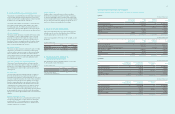
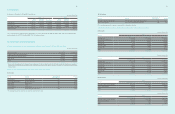
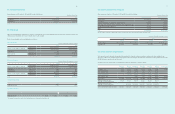
B) Long-term available-for-sale financial assets
Long-term available-for-sale financial assets as of December 31, 2011 and 2010 are as follows :
Detail 2011 2010
Equity securities-Listed (1) ₩2,526,187 ₩2,664,082
Equity securities-Unlisted (2) 623,739 326,359
Debt securities 73,672 49,765
₩ 3,223,598 ₩ 3,040,206
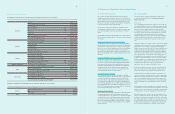
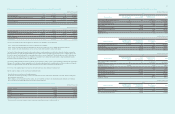
(1) Equity securities-Listed
Listed equity securities as of December 31, 2011 and 2010, are as follows :
(In millions of Korean Won, except for the number of shares and percentage)
2011 2010
Number of
Shares Owned
Percentage of
Ownership (%)
Acquisition
Cost
Recorded
Book Value
Recorded
Book Value
Samsung Heavy Industries 40,675,641 17.6 ₩ 258,299 ₩ 1,134,850 ₩ 1,675,836
Samsung Fine Chemicals 2,164,970 8.4 45,678 132,063 179,476
Samsung Life Insurance - - - - 134,878
Hotel Shilla 2,004,717 5.0 13,957 77,182 55,631
Cheil Worldwide 2,998,725 2.6 2,920 56,826 41,532
iMarket Korea 647,320 1.8 324 10,487 103,360
A-Tech Solution 1,592,000 15.9 26,348 17,830 33,432
SFA 1,822,000 10.2 38,262 111,142 89,278
SNU Precision 1,075,446 5.3 14,204 11,400 18,874
KT Skylife¹ 240,000 0.5 3,000 6,576 -
Rambus 4,788,125 4.4 92,682 41,692 223,363
Seagate Technology 45,239,490 9.7 788,454 855,665 -
Others - - 17,464 70,474 108,422
₩ 1,301,592 ₩ 2,526,187 ₩ 2,664,082
¹ KT Skylife was listed at the Korea Exchange stock market of republic of Korea during the current year.
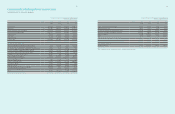
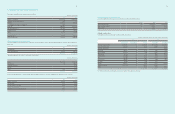
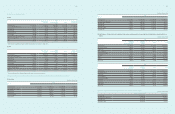
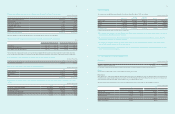
7. Available-for-Sale Financial Assets
The changes of available-for-sale financial assets are as follows :
(In millions of Korean Won)
2011 2010
Balance as of January1₩ 4,199,358 ₩ 3,593,558
Translation and exchange difference 1,007 447
Additions 2,390,143 3,815,003
- Additions from business combinations 1,018 -
Disposals (2,004,296) (4,378,927)
Fair value gains (losses) (559,831) 1,193,297
Impairment losses (39) (10,719)
Others (65,775) (13,301)
Balance as of December 31 ₩ 3,879,567 ₩ 4,199,358
A) Current portion 655,969 1,159,152
B) Non-current portion 3,223,598 3,040,206
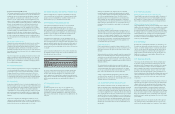
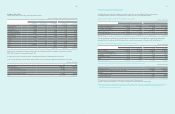
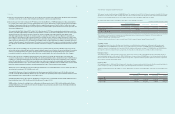
A) Short-term available-for-sale financial assets
Short-term available-for-sale financial assets as of December 31, 2011 and 2010, consist of national bonds and beneficiary certificates whose maturities are
within 1 year.
(In millions of Korean Won)
2011 2010
National bonds ₩ - ₩ 8
Beneficiary certificates¹ 655,969 1,159,144
₩ 655,969 ₩ 1,159,152
¹ Beneficiary certificates as of December 31, 2011 and 2010, are as follows :
(In millions of Korean Won)
2011 2010
Bonds ₩ 647,379 ₩ 995,400
Time deposits 715 100,572
Certificates of deposit - 39,708
Call loan - 9,606
Others 7,875 13,858
₩ 655,969 ₩ 1,159,144
For the years ended December 31, 2011 and 2010, changes in valuation gain (loss) on short-term available-for-sale financial assets are as follows :
(In millions of Korean Won)
2011 2010
Balance at January 1 ₩9,144 ₩4,420
Fair value gains 5,969 9,144
Net gains transfer from equity (9,144) (4,420)
Balance at December 31 5,969 9,144
Deferred income tax and minority interest (1,444) (2,213)
₩ 4,525 ₩ 6,931