Samsung 2011 Annual Report Download - page 31
Download and view the complete annual report
Please find page 31 of the 2011 Samsung annual report below. You can navigate through the pages in the report by either clicking on the pages listed below, or by using the keyword search tool below to find specific information within the annual report.-
 1
1 -
2
-
3
-
4
-
5
-
6
-
7
-
8
-
9
-
10
-
11
-
12
-
13
-
14
-
15
-
16
-
17
-
18
-
19
-
20
-
 21
21 -
 22
22 -
 23
23 -
 24
24 -
 25
25 -
 26
26 -
 27
27 -
 28
28 -
 29
29 -
 30
30 -
 31
31 -
 32
32 -
 33
33 -
 34
34 -
 35
35 -
 36
36 -
 37
37 -
 38
38 -
 39
39 -
 40
40 -
 41
41 -
42
-
43
-
44
-
45
-
46
-
47
-
48
-
49
-
50
-
51
-
52
 |
 |

56
57
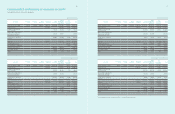
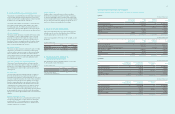
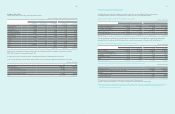
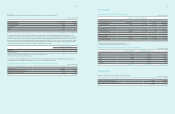
D) Income and loss of financial instruments by category for the years ended December 31, 2011 and 2010, are as follows :
(In millions of Korean won)
2011
Financial Assets
Assets at fair value
through the profit
and loss
Loans
and receivables
Available-for-sale
financial assets Total
Loss on valuation (Other comprehensive loss) ₩-₩-₩ (559,831) ₩ (559,831)
Loss on valuation / disposal 113,401 -102,351 215,752
Gain on disposal (Reclassification) - - 134,202 134,202
Interest income - 702,198 3,455 705,653
Gain on foreign currency translation - 27,768 -27,76 8
Loss on foreign currency transaction - (483,980) (2,924) (486,904)
Dividend income - - 34,423 34,423
Impairment / Reversal - - (39) (39)
(In millions of Korean won)
2011
Financial Liabilities
Liabilities at fair
value through the
profit and loss
Financial liabilities
measured at
amortized cost
Other Financial
Liabilities Total
Loss on valuation / disposal (Profit or loss) ₩ (1,865) ₩-₩-₩ (1,865)
Interest expense - 555,581 85,073 640,654
Gain (Loss) on foreign currency translation - (69,049) 26,559 (42,490)
Loss on foreign currency transaction - (163,191) - (163,191)
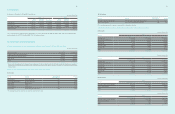
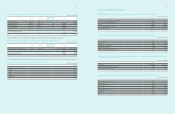
(In millions of Korean won)
2010
Financial Assets
Assets at fair value
through the profit
and loss
Loans
and receivables
Available-for-sale
financial assets Total
Gain on valuation (Other comprehensive
income or loss) ₩-₩-₩1,193,297 ₩1,193,297
Gain (Loss) on valuation / disposal
(Profit or loss) (32,341) - 27, 319 (5,022)
Gain on disposal (Reclassification) - - 4,420 4,420
Interest income - 556,624 1,489 558,113
Loss on foreign currency translation - (103,896) - (103,896)
Loss on foreign currency transaction - (239,877) - (239,877)
Dividend income - - 32,829 32,829
Impairment / Reversal - - (10,719) (10,719)
(In millions of Korean won)
2010
Financial Liabilities
Liabilities at fair
value through the
profit and loss
Financial liabilities
measured at
amortized cost
Other Financial
Liabilities Total
Interest expense ₩-₩579,588 ₩-₩579,588
Gain (Loss) on foreign currency translation - 193,259 (6,897) 186,362
Loss on foreign currency transaction - (22,289) - (22,289)
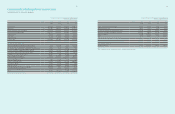
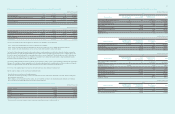
B) The following table presents the assets and liabilities that are measured at fair value at 31 December 2011.
(In millions of Korean won)
Level 1 Level 2 Level 3 Total balance
Short-term derivatives ₩-₩130,057 ₩-₩130,057
Long and short-term Available-for-sale financial assets 3,182,157 73,672 623,738 3,879,567
Total assets ₩ 3,182 ,157 ₩ 203,729 ₩ 623,738 ₩ 4,009,624
Short-term derivatives - 40,932 -40,932
Total liabilities ₩-₩ 40,932 ₩ - ₩ 40,932
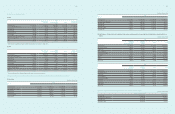
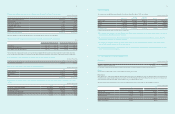
The following table presents the assets and liabilities that are measured at fair value at 31 December 2010.
(In millions of Korean won)
Level 1 Level 2 Level 3 Total balance
Short-term derivatives ₩-₩34,458 ₩-₩34,458
Long and short-term Available-for-sale financial assets 3,823,234 49,765 326,359 4,199,358
Total assets ₩ 3,823,234 ₩ 84,223 ₩ 326,359 ₩ 4,233,816
Short-term derivatives -24,638 -24,638
Total liabilities ₩ -₩ 24,638 ₩ -₩ 24,638
The levels of the fair value hierarchy and its application to financial assets and liabilities are described below
∙ Level 1 : Quoted prices (unadjusted) in active markets for identical assets or liabilities
∙ Level 2 : Inputs other than quoted prices included within level 1 that are observable for the asset or liability, either directly or indirectly
∙ Level 3 : Inputs for the asset or liability that are not based on observable market data (that is, unobservable inputs)
The fair value of financial instruments traded in active markets is based on quoted market prices at the balance sheet date. A market is regarded as
active if quoted prices are readily and regularly available from an exchange, dealer, broker, industry group, pricing service, or regulatory agency, and
those prices represent actual and regularly occurring market transactions on an arm’s length basis. The quoted market price used for financial assets
held by the group is the current bid price. These instruments are included in level 1. Instruments included in level 1 comprise primarily listed equity
investments classified as trading securities or available-for-sale.
The fair value of financial instruments that are not traded in an active market (for example, over-the-counter derivatives) is determined by using valuation
techniques. These valuation techniques maximize the use of observable market data where it is available and rely as little as possible on entity specific
estimates. If all significant inputs required to fair value an instrument are observable, the instrument is included in level 2.
If one or more of the significant inputs is not based on observable market data, the instrument is included in level 3.
Specific valuation techniques used to value financial instruments include :
∙ Quoted market prices or dealer quotes for similar instruments.
∙ The fair value of forward foreign exchange contracts is determined using forward exchange rates at the balance sheet date, with the resulting value
discounted back to present value.
∙ Other techniques, such as discounted cash flow analysis, are used to determine fair value for the remaining financial instruments. As for trade and
other receivables, the book value approximates a reasonable estimate of fair value.
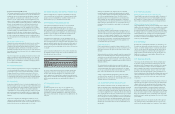
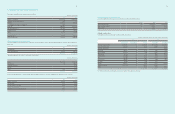
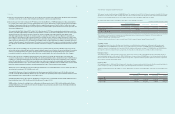
C) The changes of the financial instruments on level 3, December 31, 2011 and 2010, are as follows :
(In millions of Korean won)
2011 2010
Balance at January 1 ₩326,359 ₩228,973
Purchase 397,86 5 136,216
Disposal (97,390) (23,714)
Comprehensive income / expense 69,004 86,683
Others¹ (72,100) (101,799)
Balance at December 31 ₩ 623,738 ₩ 326,359
¹ Others consist of the effects from changes in currency exchange rate, acquisitions from business combination and etc.