Samsung 2011 Annual Report Download - page 41
Download and view the complete annual report
Please find page 41 of the 2011 Samsung annual report below. You can navigate through the pages in the report by either clicking on the pages listed below, or by using the keyword search tool below to find specific information within the annual report.-
 1
1 -
2
-
3
-
4
-
5
-
6
-
7
-
8
-
9
-
10
-
11
-
12
-
13
-
14
-
15
-
16
-
17
-
18
-
19
-
20
-
21
-
22
-
23
-
24
-
25
-
26
-
27
-
28
-
29
-
30
-
 31
31 -
 32
32 -
 33
33 -
 34
34 -
 35
35 -
 36
36 -
 37
37 -
 38
38 -
 39
39 -
 40
40 -
 41
41 -
 42
42 -
 43
43 -
 44
44 -
 45
45 -
 46
46 -
 47
47 -
 48
48 -
 49
49 -
 50
50 -
 51
51 -
52
 |
 |

76 77
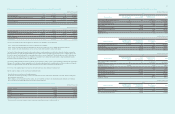
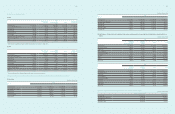
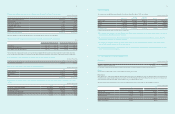
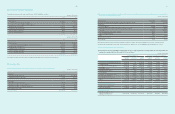
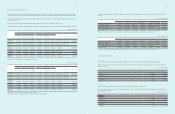
19. Retained Earnings
Retained earnings as of December 31, 2011 and 2010, consist of the following :
(In millions of Korean Won)
2011 2010
Appropriated ₩78,713,318 ₩63,144,630
Unappropriated 18,829,207 21,869,920
Total ₩ 97,542,525 ₩ 85,014,550
20. Dividends
SEC declared cash dividends to shareholders of common stock and preferred stock as interim dividends for the six-month periods ended June 30, 2011 and
2010 and as year-end dividends for the years ended December 31, 2011 and 2010.
Details of interim dividends and year-end dividends are as follows :
A) Interim Dividends
(In millions of Korean Won and number of shares)
2011 2010
Number of shares eligible for dividends Common stock 130,148,288 shares 129,558,812 shares
Preferred stock 19,853,734 shares 19,853,734 shares
Dividend rate 10% 100%
Dividend amount Common stock ₩ 65,074 ₩ 647,794
Preferred stock 9,927 99,269
Total ₩ 75,001 ₩ 747,063
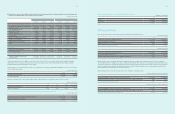
B) Year-end Dividends
(In millions of Korean Won and number of shares)
2011 2010
Number of shares eligible for dividends Common stock 130,386,723 shares 129,843,077 shares
Preferred stock 19,853,734 shares 19,853,734 shares
Dividend rate Common stock 100% 100%
Dividend amount Preferred stock 101% 101%
Number of shares eligible for dividends Common stock ₩651,934 ₩649,216
Preferred stock 100,261 100,261
Total ₩ 752,195 ₩ 749,477
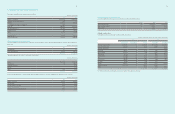
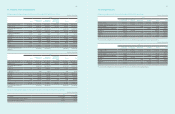
C) Dividend Payout Ratio
2011 2010
Dividend payout ratio 6.19% 9.47%
D) Dividend Yield Ratio
2011 2010
Common Stock Preferred Stock Common Stock Preferred Stock
Dividend yield ratio¹ 0.52% 0.85% 1.07% 1.57%
¹ The average closing price for a week before 2 trading days prior to closing date of shareholders’ list.
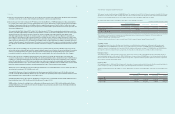
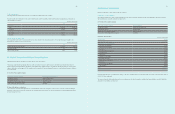
21. Other Components of Equity
Other components of equity as of December 31, 2011 and 2010, consist of the following :
(In millions of Korean Won)
December 31, 2011 December 31, 2010
Treasury stock¹ ₩ (7,539,561) ₩ (7,761,927)
Stock option 55,313 128,320
Unrealized holding gains on available-for-sale financial assets 1,040,849 1,608,035
Share of associates and joint ventures accumulated other comprehensive gains 1,071,435 1,185,333
Foreign-currency translation differences (834,145) (957,579)
Others 961,942 1,071,420
Total ₩ (5,244,167) ₩ (4,726,398)
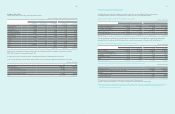
¹ As of December 31, 2011, the company holds 16,912,614 common shares and 2,979,693 preferred shares as treasury stocks.
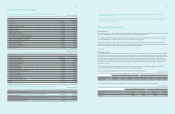
(In millions of Korean Won and number of shares)
2011 2010
Preferred
Stock
Common
Stock
Preferred
Stock
Common
Stock
Number of shares 2,979,693 shares 16,912,614 shares 2,979,693 shares 17,456,260 shares
Acquisition cost ₩ 621,843 ₩ 6,917,718 ₩ 621,843 ₩ 7,140,084
22. Share Based Compensation
The Company has a stock option plan that provides for the granting of stock purchase options to employees or directors who have contributed or are
expected to contribute to the management and technological innovation of the Company. No Share based compensation has been granted since December
20, 2005. All options currently in issue are fully vested.
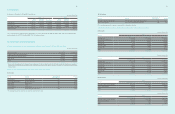
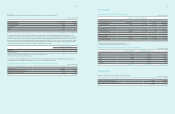
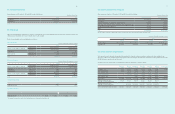
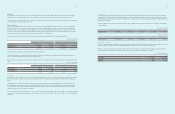
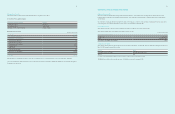
A summary of the terms and the number of outstanding stock options as of December 31, 2011 is as follows :
March 16,
2000
March 9,
2001
February 28,
2002
March 25,
2002
March 7,
2003
April 16,
2004
December 20,
2005
At January 1, 2010 54,507 449,409 275,504 32,854 108,835 463,902 10,000
Exercised during 2010 54,507 273,337 115,283 1,879 33,960 119,334 -
At December 31, 2010 - 176,072 160,221 30,975 74,875 344,568 -
Exercised During 2011 - 176,072 112,62 6 28,046 25,624 143,282 -
At December 31, 2011 - - 47,59 5 2,929 49,251 201,286 10,000
Exercise price ₩272,700 ₩197,100 ₩329,200 ₩342,800 ₩288,800 ₩580,300 ₩606,700
Weighted average share price
at the date of exercise during 2010 779,377 853,456 845,473 840,201 852,484 863,578 -
Weighted average share price
at the date of exercise during 2011 -₩943,994 ₩949,456 ₩931,977 ₩935,942 ₩998,175 -
Exercise period from the date of the grant 3-10 years 3-10 years 2-10 years 2-10 years 2-10 years 2-10 years 2-10 years