Samsung 2011 Annual Report Download - page 34
Download and view the complete annual report
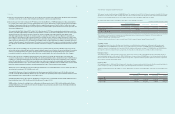
Please find page 34 of the 2011 Samsung annual report below. You can navigate through the pages in the report by either clicking on the pages listed below, or by using the keyword search tool below to find specific information within the annual report.-
 1
1 -
2
-
3
-
4
-
5
-
6
-
7
-
8
-
9
-
10
-
11
-
12
-
13
-
14
-
15
-
16
-
17
-
18
-
19
-
20
-
21
-
22
-
23
-
 24
24 -
 25
25 -
 26
26 -
 27
27 -
 28
28 -
 29
29 -
 30
30 -
 31
31 -
 32
32 -
 33
33 -
 34
34 -
 35
35 -
 36
36 -
 37
37 -
 38
38 -
 39
39 -
 40
40 -
 41
41 -
 42
42 -
 43
43 -
 44
44 -
45
-
46
-
47
-
48
-
49
-
50
-
51
-
52
 |
 |

62
63
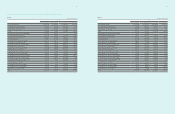
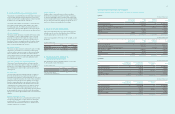
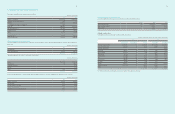
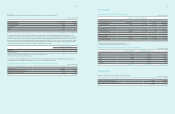
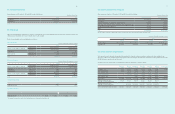
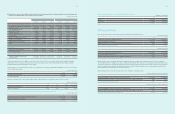
9. Inventories
Inventories as of December 31, 2011 and 2010, are as follows :
(In millions of Korean Won)
2011 2010
Gross
Amount
Valuation
Allowance Book Value Gross
Amount
Valuation
Allowance Book Value
Finished goods ₩ 6,105,312 ₩ (199,432) ₩5,905,880 ₩4,643,155 ₩ (131,764) ₩4,511,391
Work in Process 3,454,823 (383,461) 3,071,362 2,903,944 (284,231) 2,619,713
Raw materials and supplies 4,673,143 (186,523) 4,486,620 4,268,697 (108,855) 4,159,842
Materials-in-transit 2,252,853 - 2,252,853 2,073,578 - 2,073,578
₩16,486,131 ₩(769,416) ₩15,716,715 ₩13,889,374 ₩ (524,850) ₩13,364,524
The cost of inventories recognized as expense and included in ‘cost of sales’ amounted to ₩ 110,802,871 million (2010 : ₩ 101,151,971 million) in which
inventory valuation loss of ₩ 575,332 million (2010 : ₩ 527,123 million) is included.
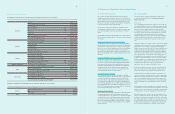
10. Associates and Joint Ventures
A) Changes in investments in associates and joint ventures for the years ended December 31, 2011 and 2010, are as follows :
(In millions of Korean Won)
2011 2010
Balance at January 1 ₩8,335,290 ₩7,334,705
Acquisition of Associates and Joint Ventures 403,538 243
Disposal of Associates and Joint Ventures (298,375) (216,733)
Share of profit 1,399,194 2,267,091
Others¹ (635,478) (1,050,016)
Balance at December 31 ₩9,204,169 ₩8,335,290
¹ Others consist of dividends and effect of change in foreign exchange rates. For the year ended December 31, 2010, it also includes effect from business combinations
of Samsung SDS and Samsung Networks amounted to ₩125,152 million which represents the difference between the fair value of received shares and the book value
of disposed shares.
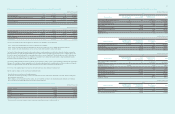
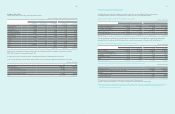
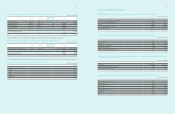
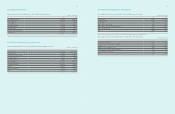
B) Major associates and Joint Ventures as of December 31, 2011, consist of the following :
(1) Associates
Investee Industry Percentage of
Ownership (%)¹Region
Samsung Card Finance, Credit card 35.3 Korea
Samsung Electro-Mechanics Electricity, Electronics 23.7 Korea
Samsung SDI Manufacturing 20.4 Korea
Samsung SDS Service 21.7 Korea
Samsung Techwin Manufacturing 25.5 Korea
Samsung LED Manufacturing, wholesale, Service 50.0 Korea
¹ The ownership represents the company’s ownership of the voting rights in the entiry.
(2) Joint ventures
Investee Industry Percentage of
Ownership (%)¹Region
Samsung Corning Precision Materials TFT- LCD components Manufacturing and retail 42.5 Korea
Siltronic Samsung Wafer Semi conductor Manufacturing and retail 50.0 Asia
¹ The ownership represents the company’s ownership of the voting rights in the entiry.
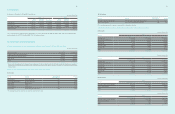
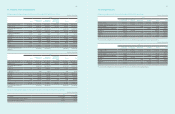
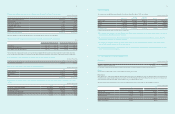
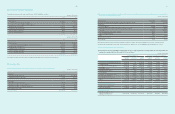
C) Details of investments in associates and joint ventures as of December 31, 2011 and 2010 are as follows :
(1) Associates
(In millions of Korean Won)
Investee 2011
Acquisition cost Net asset value Book value
Samsung Card ₩ 1,538,540 ₩ 2,167,986 ₩ 2,184,855
Samsung Electro-Mechanics 359,237 883,680 799,792
Samsung SDI 423,722 1,242,699 1,185,509
Samsung SDS 17,967 643,578 632,593
Samsung Techwin 174,531 417,708 370,379
Samsung LED 180,916 311,545 340,145
Others 269,787 354,602 371,909
Total ₩2,964,700 ₩6,021,798 ₩5,885,182
(In millions of Korean Won)
Investee 2010
Acquisition cost Net asset value Book value
Samsung Card ₩ 1,538,540 ₩ 2,132,986 ₩ 2,201,154
Samsung Electro-Mechanics 359,237 867,047 793,932
Samsung SDI 423,722 1,226,234 1,172,130
Samsung SDS 17,967 572,135 569,678
Samsung Techwin 174,531 323,503 269,360
Samsung LED 180,916 275,682 306,005
Others 88,974 191,838 192,243
Total ₩2,783,887 ₩5,589,425 ₩5,504,502
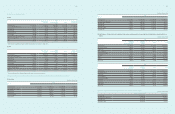
(2) Joint ventures
(In millions of Korean Won)
Investee 2011
Acquisition cost Net asset value Book value
Samsung Corning Precision Materials ₩ 297,165 ₩ 3,191,077 ₩ 3,089,298
Siltronic Samsung Wafer 266,949 66,843 154,272
Others 152,512 79,027 75,417
Total ₩716,626 ₩3,336,947 ₩3,318,987
(In millions of Korean Won)
Investee 2010
Acquisition cost Net asset value Book value
Samsung Corning Precision Materials ₩ 297,165 ₩ 2,431,248 ₩ 2,599,010
Siltronic Samsung Wafer 266,949 105,069 192,500
Others 152,512 43,026 39,278
Total ₩716,626 ₩2,579,343 ₩2,830,788