Samsung 2011 Annual Report Download - page 3
Download and view the complete annual report
Please find page 3 of the 2011 Samsung annual report below. You can navigate through the pages in the report by either clicking on the pages listed below, or by using the keyword search tool below to find specific information within the annual report.-
 1
1 -
 2
2 -
 3
3 -
 4
4 -
 5
5 -
 6
6 -
 7
7 -
 8
8 -
 9
9 -
 10
10 -
 11
11 -
 12
12 -
 13
13 -
 14
14 -
15
-
16
-
17
-
18
-
19
-
20
-
21
-
22
-
23
-
24
-
25
-
26
-
27
-
28
-
29
-
30
-
31
-
32
-
33
-
34
-
35
-
36
-
37
-
38
-
39
-
40
-
41
-
42
-
43
-
44
-
45
-
46
-
47
-
48
-
49
-
50
-
51
-
52
 |
 |

02
03
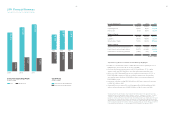
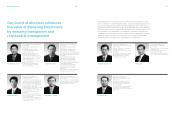
2011 Samsung Electronics Financial and Strategic Highlights
In 2011, we achieved sales revenue of KRW 165 trillion with an operating income of
KRW 16 trillion, an increase of 6.7% in sales over 2010.
Our financial structure remains robust, with 32.1% liability ratio, 75.7% capital
adequacy ratio and KRW 10 trillion in cash after deducting outstanding loans.
At the end of 2011, Samsung Electronics recorded a rise in share price of 11%, or
KRW 1,058,000, compared to 2010, exceeding the market return. Shareholders
were paid an interim dividend of KRW 500 per share and a year-end dividend of
KRW 5,000 per share.
Investment in facilities totaled KRW 20.9 trillion in 2011 and is expected to increase
to KRW 24.2 trillion in 2012.
Samsung Electronics ranked 17th on the Interbrand Best 100 Global Brands 2011,
with an estimated brand value of USD 23.4 billion, a 20% increase over 2010.
Income Statements 2009 2010 2011
Sales 136,324 154,630 165,002
Operating Profit 10,925 17,297 16,250
Net Income 9,761 16,147 13,734
Balance Sheets
Assets 112,180 134,289 155,631
Liabilities 39,135 44,940 53,786
Shareholders’ Equity 73,045 89,349 101,846
Balance Sheets
Cash Flows from Operating Activities 18,522 23,827 22,918
Cash Flows from Investing Activities (14,177) (23,985) (21,113)
Cash Flows from Financing Activities (1,364) (152) 3,110
a
2009 2010 2011
136,324
154,630
165,002
2009 2010 2011
18,522
23,827
22,918
(14,177)
(23,985)
(21,113)
10,925
17, 2 97
16,250
Sales And Operating Profit
Sales
Cash Flows
Cash Flows from Operating Activities
Cash Flows from Investing Activities
Operating Profit
(in billions of KRW) (in billions of KRW)
2011 Financial Summary
Samsung Electronics and Consolidated Subsidiaries
This annual report includes forward-looking statements that relate to future events and can be generally
identified by phrases containing words such as “believes,” “expects,” “anticipates,” “foresees,” “forecasts,”
“estimates” or other words or phrases of similar meaning. These forward-looking statements are not
guarantees of future performance and may involve known and unknown risks, uncertainties and other factors
that may affect our actual results, performance, achievements or financial position, making them materially
different from the actual future results, performance, achievements or financial position expressed or implied
by these forward-looking statements. Unless otherwise specified, all data presented in this report is from our
consolidated financial statements. (※We have applied K-IFRS standards to our data since 2009.)
(in billions of KRW)