Samsung 2011 Annual Report Download - page 37
Download and view the complete annual report
Please find page 37 of the 2011 Samsung annual report below. You can navigate through the pages in the report by either clicking on the pages listed below, or by using the keyword search tool below to find specific information within the annual report.-
 1
1 -
2
-
3
-
4
-
5
-
6
-
7
-
8
-
9
-
10
-
11
-
12
-
13
-
14
-
15
-
16
-
17
-
18
-
19
-
20
-
21
-
22
-
23
-
24
-
25
-
26
-
 27
27 -
 28
28 -
 29
29 -
 30
30 -
 31
31 -
 32
32 -
 33
33 -
 34
34 -
 35
35 -
 36
36 -
 37
37 -
 38
38 -
 39
39 -
 40
40 -
 41
41 -
 42
42 -
 43
43 -
 44
44 -
 45
45 -
 46
46 -
 47
47 -
48
-
49
-
50
-
51
-
52
 |
 |

68
69
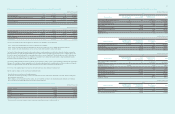
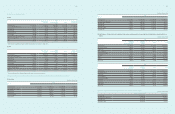
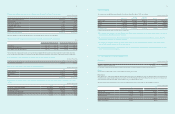
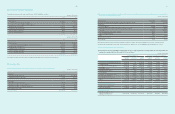
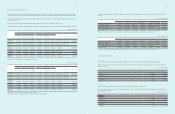
B) Goodwill
Goodwill is allocated to Cash-Generating Units at the end of the reporting period, and consists of the following :
(In millions of Korean Won)
2011 2010
Samsung Digital Imaging ₩287,199 ₩470,344
Samsung Mobile Display 80,299 80,299
Samsung Medison 74,347 -
Grandis 39,883 -
Others 41,681 20,769
Total ₩523,409 ₩571,412
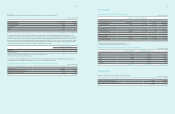
Goodwill impairment reviews are undertaken annually. Impairment test suggests that, except for Samsung Digital Imaging, the carrying value of cash
generating units does not exceed the recoverable amount. The recoverable amounts of cash-generating units have been determined based on value-in-use
calculations. These calculations use pre-tax cash flow projections based on financial budgets approved by management covering a five-year period. Cash
flows beyond the five-year period are extrapolated using the estimated growth rates stated below. The growth rate does not exceed the long-term average
growth rate for the business in which Samsung Digital Imaging operates. In addition, a constant growth rate assumption is used for perpetual cash flow
calculation. The key assumptions used for value-in-use calculations in 2011 and 2010, are as follows :
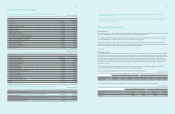
Samsung Digital Imaging
2011 2010
Growth rate¹ 2.1 2.5
Pre-tax discount rate² 13.6 15.2
¹ Growth rate is consistent with the projected growth rate over five years in the industry reports.
² Pre-tax discount rate applied to the cash flow projections.
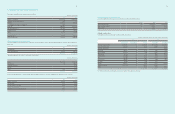
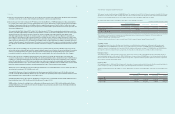
The carrying value of Samsung Digital Imaging exceeded the value in use by ₩ 183,145 million in 2011 and ₩ 153,940 million in 2010 and the amount
exceeded carrying value is recognized as the other gains / losses- net in the consolidated income statements.
C) Details of amortization of intangible assets as of December 31, 2011 and 2010, consist of the following :
(In millions of Korean Won)
Account 2011 2010
Production costs ₩266,101 ₩236,275
Selling general and administrative expenses 300,497 227,195
Research and development expenses 91,192 83,052
Total ₩657,79 0 ₩546,522
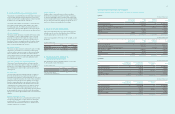
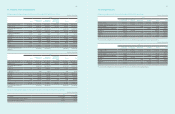
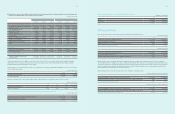
13. Borrowings
A) Borrowings as of December 31, 2011 and 2010, are as follows :
(In millions of Korean Won)
Financial
Institutions
Annual Interest Rates (%)
as of December 31, 2011 2011 2010
Short-term borrowings
Collateralized borrowings¹ Woori Bank etc 0.9 ~ 7.1 ₩4,878,383 ₩5,090,433
Without collateralized CITI etc 0.4 ~ 10.8 4,775,339 3,339,288
Total ₩ 9,653,722 ₩ 8,429,721
Current Portion of long-term borrowings
Bank borrowings DBJ etc 2.8 ~ 4.5 ₩10,820 ₩1,008,884
Financial lease liabilities² APCI etc 2.2 ~ 15.6 13,936 9,591
Total ₩ 24,756 ₩ 1,018,475
Long-term borrowings
Bank borrowings SMBC etc 1.1 ~ 5.8 ₩3,559,554 ₩536,871
Financial lease liabilities² APCI etc 2.2 ~ 15.6 122,918 97,510
Total ₩ 3,682,472 ₩ 634,381
¹ Collateralized borrowings are secured by trade receivables (note 8).
² Leased property, plant and equipment were pledged as collateral (note 17).
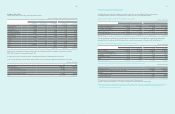
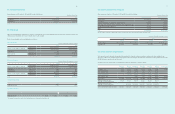
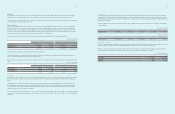
B) Maturities of long-term borrowings, outstanding as of December 31, 2011, are as follows :
(In millions of Korean Won)
Long-term borrowings
in local currency
Long-term borrowings
in foreign currency Total
For the Years Ending December 31
2012 ₩6,899 ₩17,8 57 ₩24,756
2013 73,326 434,612 507,9 38
2014 944,064 1, 527, 319 2,471,383
2015 - 6,955 6,955
Thereafter 1,650 694,546 696,196
Total ₩1,025,939 ₩2,681,289 ₩3,707,228
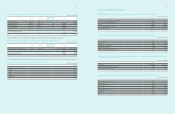
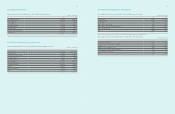
14. Debentures
Debentures as of December 31, 2011 and 2010, consist of the following :
(In millions of Korean Won)
2011 2010
Korean Won denominated debenture (A) ₩1,197,079 ₩500,000
Foreign currency denominated debenture (B) 83,045 87,338
Total ₩1,280,124 ₩587,338