Samsung 2011 Annual Report Download - page 43
Download and view the complete annual report
Please find page 43 of the 2011 Samsung annual report below. You can navigate through the pages in the report by either clicking on the pages listed below, or by using the keyword search tool below to find specific information within the annual report.-
 1
1 -
2
-
3
-
4
-
5
-
6
-
7
-
8
-
9
-
10
-
11
-
12
-
13
-
14
-
15
-
16
-
17
-
18
-
19
-
20
-
21
-
22
-
23
-
24
-
25
-
26
-
27
-
28
-
29
-
30
-
31
-
32
-
 33
33 -
 34
34 -
 35
35 -
 36
36 -
 37
37 -
 38
38 -
 39
39 -
 40
40 -
 41
41 -
 42
42 -
 43
43 -
 44
44 -
 45
45 -
 46
46 -
 47
47 -
 48
48 -
 49
49 -
 50
50 -
 51
51 -
 52
52
 |
 |

80
81
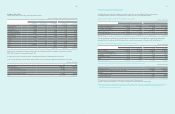
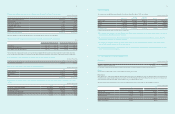
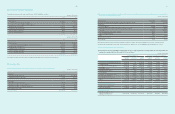
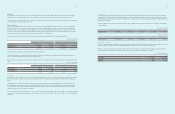
26. Financial Income and Costs
Financial income and costs for the years ended December 31, 2011 and 2010 are as follows :
(In millions of Korean Won)
2011 2010
Finance income
Interest income ₩705,653 ₩558,113
Interest income from loans and receivables 70 2,198 556,624
Interest income from available-for-sale financial assets 3,455 1,489
Realized foreign exchange gains 5,582,146 6,012,626
Unrealized foreign exchange gains 538,602 496,543
Gains on valuation of derivatives 80,103 74,357
Gains on derivatives transaction 497,021 323,489
₩7,403,525 ₩7,465,128
(In millions of Korean Won)
2011 2010
Finance expense
Interest expense : ₩644,133 ₩581,091
Interest expense from financial liabilities measured at amortized cost 644,133 581,091
Realized foreign exchange losses 6,232,241 6,274,744
Unrealized foreign exchange losses 553,324 414,077
Losses on valuation of derivatives 59,697 49,728
Losses on derivatives transaction 404,026 380,459
₩7,893,421 ₩7,700,099
The company recognizes the profits and losses regarding translation differences as financial income and expenses.
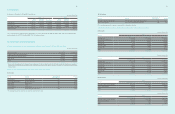
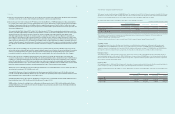
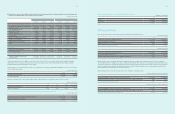
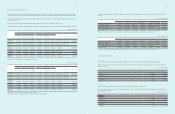
27. Income Tax
A) Income tax expense for the years ended December 31, 2011 and 2010, consists of the following :
(In millions of Korean Won)
2011 2010
Current taxes :
Current tax on profits for the year ₩3,051,406 ₩3,330,420
Adjustments in respect of prior years 95,670 (163,739)
3,147,076 3,166,681
Deferred taxes :
Deferred income taxes - tax credit (75,311) (363,802)
Deferred income taxes - temporary difference 373,788 3 41,137
Deferred income taxes - accumulated operating loss (22,599) 41,036
Items charged directly to equity 1,994 (2,921)
Income tax expense ₩ 3,424,948 ₩ 3,182,131
B) The tax on the company’s profit before tax differs from the theoretical amount that would arise using the weighted average tax rate applicable to
profits of the consolidated entities as follows :
(In millions of Korean Won)
2011 2010
Income before tax ₩17,159,015 ₩19,328,656
Tax calculated at domestic tax rates applicable to profits in the respective countries 4,346,235 4,712,450
Tax effects of :
Permanent difference (393,004) (126,283)
Temporary differences for which no deferred income tax was recognized 7,309 (88,469)
Tax credit (1,633,452) (1,887,582)
Overseas subsidiaries and associates operations 906,505 527,553
Impact of changes in tax rates 140,181 -
Other 51,174 44,462
Actual income tax expense ₩3,424,948 ₩3,182,131
Effective tax rate 19.96% 16.46%
The weighted average tax rate increased in 2011 compared to 2010 due to changes of the tax rates primarily due to an increase of tax rates in Korea.
According to the revised tax law as of December 31, 2011, tax rate for the taxable income over ₩ 20,000 million has changed from 22% to 24.2%.
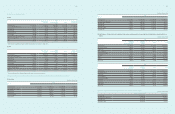
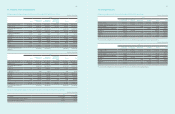
C) Details of deferred income tax assets and liabilities :
(1) Deferred income tax assets and liabilities resulting from the tax effect of temporary differences including available tax credit carryforwards and
undisposed accumulated deficit as of December 31, 2011, are as follows :
(In millions of Korean Won)
Temporary Differences Deferred Income Tax Asset (Liabilities)
Beginning
Balance
Increase
(Decrease)
Ending
Balance
Beginning
Balance
Increase
(Decrease)
Ending
Balance
Deferred tax arising from temporary differences
Special reserves appropriated for tax purposes ₩ (18,146) ₩ – ₩ (18,146) ₩ (3,992) ₩ (399) ₩ (4,391)
Revaluation of land (3,984,173) (33,143) (4,017,316) (876,518) (95,673) (972,191)
Associates and joint ventures and other
investments (14,160,207) 709,670 (13,450,537) (2,109,299) (922,969) (3,032,268)
Depreciations and etc. 130,396 (103,421) 26,975 (9,325) (42,993) (52,318)
Capitalized interest expense (39,867) (655) (40,522) (8,810) (996) (9,806)
Accrued income (144,621) 51,668 (92,953) (34,930) 13,593 (21,337)
Allowance (technical expense, others) 3,742,343 3,402,088 7,144,431 926,713 879,801 1,806,514
Foreign currency translation (23,022) 173,930 150,908 (6,568) 42,050 35,482
Impairment losses on investments 45,420 7,481 52,901 9,994 943 10,937
Others 2,047,725 (1,155,538) 892,187 583,400 (268,043) 315,357
₩ (12,404,152) ₩ 3,052,080 ₩ (9,352,072) ₩ (1,529,335) ₩ (394,686)₩ (1,924,021)
Deferred tax assets arising from the
carryforwards
Undisposed accumulated deficit ₩ 40,822 ₩ 59,579 ₩ 100,401 ₩ 4,362 ₩ 22,599 ₩ 26,961
Tax credit carryforwards 1,581,825 (352,538) 1,229,287 1,420,436 75,311 1,495,747
Deferred items recognized in other
comprehensive income
Valuation of available-for-sale
financial assets and others ₩ (2,274,471) ₩ 3,591,334 ₩1,316,863 ₩ (424,121) ₩ 106,069 ₩ (318,052)