Samsung 2011 Annual Report Download - page 21
Download and view the complete annual report
Please find page 21 of the 2011 Samsung annual report below. You can navigate through the pages in the report by either clicking on the pages listed below, or by using the keyword search tool below to find specific information within the annual report.-
 1
1 -
2
-
3
-
4
-
5
-
6
-
7
-
8
-
9
-
10
-
 11
11 -
 12
12 -
 13
13 -
 14
14 -
 15
15 -
 16
16 -
 17
17 -
 18
18 -
 19
19 -
 20
20 -
 21
21 -
 22
22 -
 23
23 -
 24
24 -
 25
25 -
 26
26 -
 27
27 -
 28
28 -
 29
29 -
 30
30 -
 31
31 -
32
-
33
-
34
-
35
-
36
-
37
-
38
-
39
-
40
-
41
-
42
-
43
-
44
-
45
-
46
-
47
-
48
-
49
-
50
-
51
-
52
 |
 |

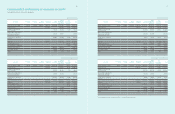
36
37
(In millions of Korean won)
2010 KRW Preferred
stock
Common
stock
Share
premium
Retained
earnings
Other
reserves
Equity
attributable
to owners
of the parent
Non-
controlling
interests
Total
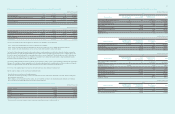
Balance at January 1, 2010 119,467 778,047 4,403,893 71,065,247 (6,801,601) 69,565,053 3,480,149 73,045,202
Profit for the year ---15,799,035 -15,799,035 347,4 90 16,146,525
Available-for-sale financial
assets, net of tax --- - 926,428 926,428 5,956 932,384
Share of other comprehensive
income of associates and
joint ventures, net of tax
-- - - 387,457 387,457 -387,457
Foreign currency translation,
net of tax - - - - (211,802) (211,802) 33,445 (178,357)
Total comprehensive income - - - 15,799,035 1,102,083 16,901,118 386,891 17,288,009
Dividends - - - (1,858,994) - (1,858,994) (71,869) (1,930,863)
Paid-in-capital increase - - - - - - (49,294) (49,294)
Effect of business combination - - - - - - 17,647 17,6 47
Disposal of treasury stock - - - - 1,060,990 1,060,990 -1,060,990
Stock option activities - - - - (84,762) (84,762) - (84,762)
Others - - - 9,262 (3,108) 6,154 (3,992) 2,162
Total transactions with owners - - - (1,849,732) 973,120 (876,612) (107,508) (984,120)
Balance at December 31, 2010 119,467 778,047 4,403,893 85,014,550 (4,726,398) 85,589,559 3,759,532 89,349,091
(In thousands of U.S. dollars (Note 2.27))
2010 USD Preferred
stock
Common
stock
Share
premium
Retained
earnings
Other
reserves
Equity
attributable
to owners
of the parent
Non-
controlling
interests
Total
Balance at January 1, 2010 103,587 674,627 3,818,515 61,619,047 (5,897,513) 60,318,263 3,017, 558 63,335,821
Profit for the year ---13,698,981 -13,698,981 301,301 14,000,282
Available-for-sale financial
assets, net of tax --- - 803,284 803,284 5,165 808,449
Share of other comprehensive
income of associates and
joint ventures, net of tax
-- - - 335,955 335,955 -335,955
Foreign currency translation,
net of tax - - - - (183,649) (183,649) 29,000 (154,649)
Total comprehensive income - - - 13,698,981 955,590 14,654,571 335,466 14,990,037
Dividends - - - (1,611,891) - (1,611,891) (62,316) (1,674,207)
Paid-in-capital increase - - - - - - (42,743) (42,743)
Effect of business combination - - - - - - 15,301 15,301
Disposal of treasury stock - - - - 919,960 919,960 -919,960
Stock option activities - - - - (73,495) (73,495) - (73,495)
Others ---8,031 (2,694) 5,337 (3,462) 1,875
Total transactions with owners - - - (1,603,860) 843,771 (760,089) (93,220) (853,309)
Balance at December 31, 2010 103,587 674,627 3,818,515 73,714,168 (4,098,152) 74,212 ,745 3,259,804 77,472,549
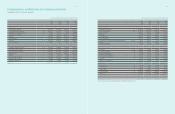
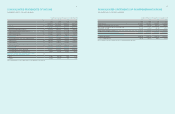
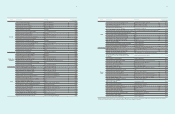
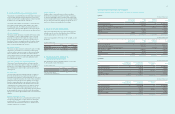
CONSOLIDATED STATEMENTS OF CHANGES IN EQUITY
Samsung Electronics Co., Ltd. and its subsidiaries
(In millions of Korean won)
2011 KRW Preferred
stock
Common
stock
Share
premium
Retained
earnings
Other
reserves
Equity
attributable
to owners of
the parent
Non-
controlling
interests
Total
Balance at January 1, 2011 119,467 778,047 4,403,893 85,014,550 (4,726,398) 85,589,559 3,759,532 89,349,091
Profit for the year ---13,359,192 -13,359,192 374,875 13,734,067
Available-for-sale financial
assets, net of tax ---- (567,186) (567,186) (4,842) (572,028)
Share of other comprehensive
income of associates and
joint ventures, net of tax
-- - - (113,898) (113,898) - (113,898)
Foreign currency translation,
net of tax - - - - 123,434 123,434 60,221 183,655
Total comprehensive income - - - 13,359,192 (557,650) 12,801,542 430,254 13,231,796
Dividends - - - (824,478) - (824,478) (156,388) (980,866)
Paid-in-capital increase - - - - (109,882) (109,882) 79,196 (30,686)
Effect of business combination - - - - - - 131,564 131,564
Disposal of treasury stock - - - - 288,773 288,773 -288,773
Stock option activities - - - - (73,008) (73,008) - (73,008)
Others - - - (6,739) (66,002) (72,741) 1,400 (71,341)
Total transactions with owners -- - (831,217) 39,881 (791,336) 55,772 (735,564)
Balance at December 31, 2011 119,467 778,047 4,403,893 97,542 ,525 (5,244,167) 97,59 9,76 5 4,245,558 101,845,323
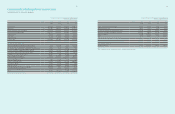
(In thousands of U.S. dollars (Note 2.27))
2011 USD Preferred
stock
Common
stock
Share
premium
Retained
earnings
Other
reserves
Equity
attributable
to owners of
the parent
Non-
controlling
interests
Total
Balance at January 1, 2011 103,587 674,627 3,818,515 73,714,168 (4,098,152) 74,212,745 3,259,804 7 7,472, 549
Profit for the year ---11,583,449 -11,583,449 325,046 11,908,495
Available-for-sale financial
assets, net of tax --- - (491,794) (491,794) (4,198) (495,992)
Share of other comprehensive
income of associates and
joint ventures, net of tax
-- - - (98,758) (98,758) - (98,758)
Foreign currency translation,
net of tax - - - - 107,027 107,027 52,216 159,243
Total comprehensive income - - - 11,583,449 (483,525) 11,099,924 373,064 11,472 ,988
Dividends - - - (714,886) - (714,886) (135,600) (850,486)
Paid-in-capital increase - - - - (95,276) (95,276) 68,669 (26,607)
Effect of business combination - - - - - - 114,076 114,076
Disposal of treasury stock - - - - 250,388 250,388 -250,388
Stock option activities - - - - (63,304) (63,304) - (63,304)
Others - - - (5,843) (57,228) (63,071) 1,213 (61,858)
Total transactions with owners - - - (720,729) 34,580 (686,149) 48,358 (637,791)
Balance at December 31, 2011 103,587 674,627 3,818,515 84,576,888 (4,547,097) 84,626,520 3,681,226 8 8,307,746
The accompanying notes are an integral part of these consolidated financial statements.