Samsung 2011 Annual Report Download - page 42
Download and view the complete annual report
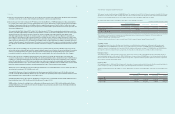
Please find page 42 of the 2011 Samsung annual report below. You can navigate through the pages in the report by either clicking on the pages listed below, or by using the keyword search tool below to find specific information within the annual report.-
 1
1 -
2
-
3
-
4
-
5
-
6
-
7
-
8
-
9
-
10
-
11
-
12
-
13
-
14
-
15
-
16
-
17
-
18
-
19
-
20
-
21
-
22
-
23
-
24
-
25
-
26
-
27
-
28
-
29
-
30
-
31
-
 32
32 -
 33
33 -
 34
34 -
 35
35 -
 36
36 -
 37
37 -
 38
38 -
 39
39 -
 40
40 -
 41
41 -
 42
42 -
 43
43 -
 44
44 -
 45
45 -
 46
46 -
 47
47 -
 48
48 -
 49
49 -
 50
50 -
 51
51 -
 52
52
 |
 |
78
79
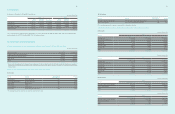
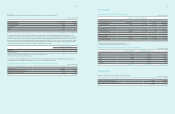
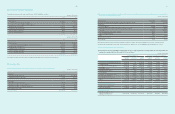
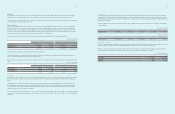
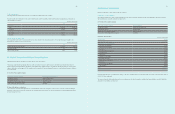
25. Other Operating Income and Expense
Other operating income for the years ended December 31, 2011 and 2010, consists of the following :
(In millions of Korean Won)
2011 2010
Dividend income ₩34,423 ₩32,829
Commission income 26,313 21,652
Rental income 92,155 96,562
Gain on disposal of investments 223,535 412,715
Gain on disposal of property, plant and equipment 113,690 282,941
Gain on transfer of business¹ 1,062,793 179,418
Other 869,000 729,324
₩ 2,421,909 ₩ 1,755,441
¹ Gain on transfer of business of 2011 consists of gain on transfer of the Solar battery business and the HDD business.
Other operating expense for the years ended December 31, 2011 and 2010, consists of the following :
(In millions of Korean Won)
2011 2010
Other bad debts expense ₩14,402 ₩15,254
Loss from disposal of property, plant and equipment 109,338 276,080
Donations 272,275 218,863
Impairment losses on intangible assets 186,759 160,173
Impairment losses on property, plant and equipment 97,517 62,919
Loss from disposal of investments 5,937 132
Other 940,864 346,514
₩ 1,627,092 ₩ 1,079,935
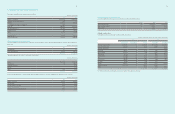
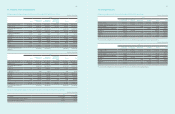
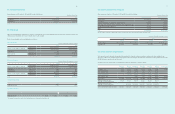
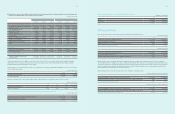
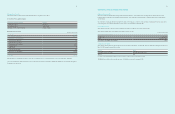
23. Expenses by Nature
Expenses by nature for the years ended December 31, 2011 and 2010, consist of the following :
(In millions of Korean Won)
2011 2010
Raw materials and goods 75,329,188 70,345,743
Wages and salaries 11,906,674 11,380,257
Pension expenses 616,999 563,408
Depreciation expenses 12,934,274 10,847,374
Amortization expenses 657,790 546,522
Welfare expenses 1,998,559 1,618,992
Commission and service charges 5,936,770 6,769,346
Other expenses 40,166,617 35,937,656
₩149,546,871 ₩138,009,298
* Expenses above equals to the sum of cost of sales, research and development expenses and selling, general and administrative expenses in the Statements of Income.
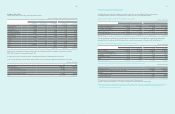
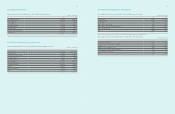
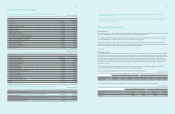
24. Selling and Administrative Expenses
Selling and administrative expenses for the years ended December 31, 2011 and 2010, are as follows :
(In millions of Korean Won)
2011 2010
Wages and salaries ₩3,551,588 ₩3,373,365
Pension expenses 148,812 155,894
Commission and service charges 5,936,770 6,769,346
Depreciation expenses 368,123 351,085
Amortization expenses 300,497 227,19 5
Advertising expenses 2,982,270 3,282,798
Sales promotion expenses 4,649,293 3,271,993
Transportation expenses 3,789,476 4,108,830
Warranty 2,805,696 2,454,601
Public relation expenses 523,149 494,599
Others 2,366,236 1,753,416
₩27,421,910 ₩26,243,122