Samsung 2011 Annual Report Download - page 35
Download and view the complete annual report
Please find page 35 of the 2011 Samsung annual report below. You can navigate through the pages in the report by either clicking on the pages listed below, or by using the keyword search tool below to find specific information within the annual report.-
 1
1 -
2
-
3
-
4
-
5
-
6
-
7
-
8
-
9
-
10
-
11
-
12
-
13
-
14
-
15
-
16
-
17
-
18
-
19
-
20
-
21
-
22
-
23
-
24
-
 25
25 -
 26
26 -
 27
27 -
 28
28 -
 29
29 -
 30
30 -
 31
31 -
 32
32 -
 33
33 -
 34
34 -
 35
35 -
 36
36 -
 37
37 -
 38
38 -
 39
39 -
 40
40 -
 41
41 -
 42
42 -
 43
43 -
 44
44 -
 45
45 -
46
-
47
-
48
-
49
-
50
-
51
-
52
 |
 |
64
65
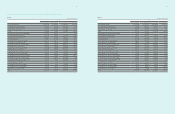
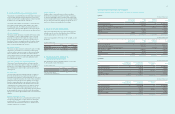
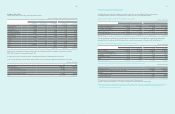
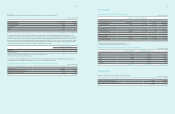
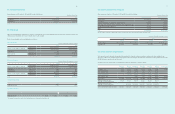
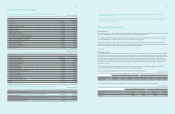
D) Gain / loss on valuation of equity
(1) 2011
Gain / loss on
valuation
Other
comprehensive
gains
Others¹Balance on
December 31
Samsung Card ₩2,201,154 ₩132,331 ₩ (80,800) ₩(67,830) ₩2,184,855
Samsung Electro-Mechanics 793,932 78,179 (50,307) (22,012) 799,792
Samsung SDI 1,172,130 63,242 (11,274) (38,589) 1,185,509
Samsung SDS 569,678 74,382 (2,939) (8,528) 632,593
Samsung Techwin 269,360 65,684 42,245 (6,910) 370,379
Samsung LED 306,005 30,669 3,471 - 340,145
Samsung Corning Precision Materials 2,599,010 975,221 (7,588) (477,345) 3,089,298
Siltronic Samsung Wafer 192,500 (37,680) (2,220) 1,672 154,272
Others 231,521 17,166 (4,486) 203,125 447,326
Total ₩8,335,290 ₩1,399,194 ₩ (113,898) ₩ (416,417) ₩9,204,169
¹ Others include acquisitions, disposals, dividends and changes in currency exchange rates.
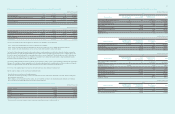
(2) 2010
Gain / loss on
valuation
Other
comprehensive
gains
Others¹ Balance on
December 31
Samsung Card ₩1,715,055 ₩421,792 ₩112,336 ₩(48,029) ₩2,201,154
Samsung Electro-Mechanics 589,981 125,877 90,768 (12,694) 793,932
Samsung SDI 960,245 71,035 140,536 314 1,172,130
Samsung SDS 276,996 79,350 4,842 208,490 569,678
Samsung Techwin 265,979 68,549 (14,526) (50,642) 269,360
Samsung LED 202,814 102,933 258 - 306,005
Samsung Corning Precision Materials 2,598,434 1,386,603 16,161 (1,402,188) 2,599,010
Siltronic Samsung Wafer 141,057 (36,497) 78,605 9,335 192,500
Others 584,144 40,857 (41,523) (351,957) 231,521
Total ₩7,334,705 ₩2,260,499 ₩387,457 ₩(1,647,371) ₩8,335,290
¹ Others include acquisitions, disposals, dividends and changes in currency exchange rates.
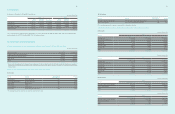
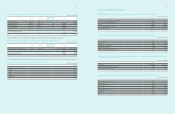
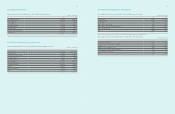
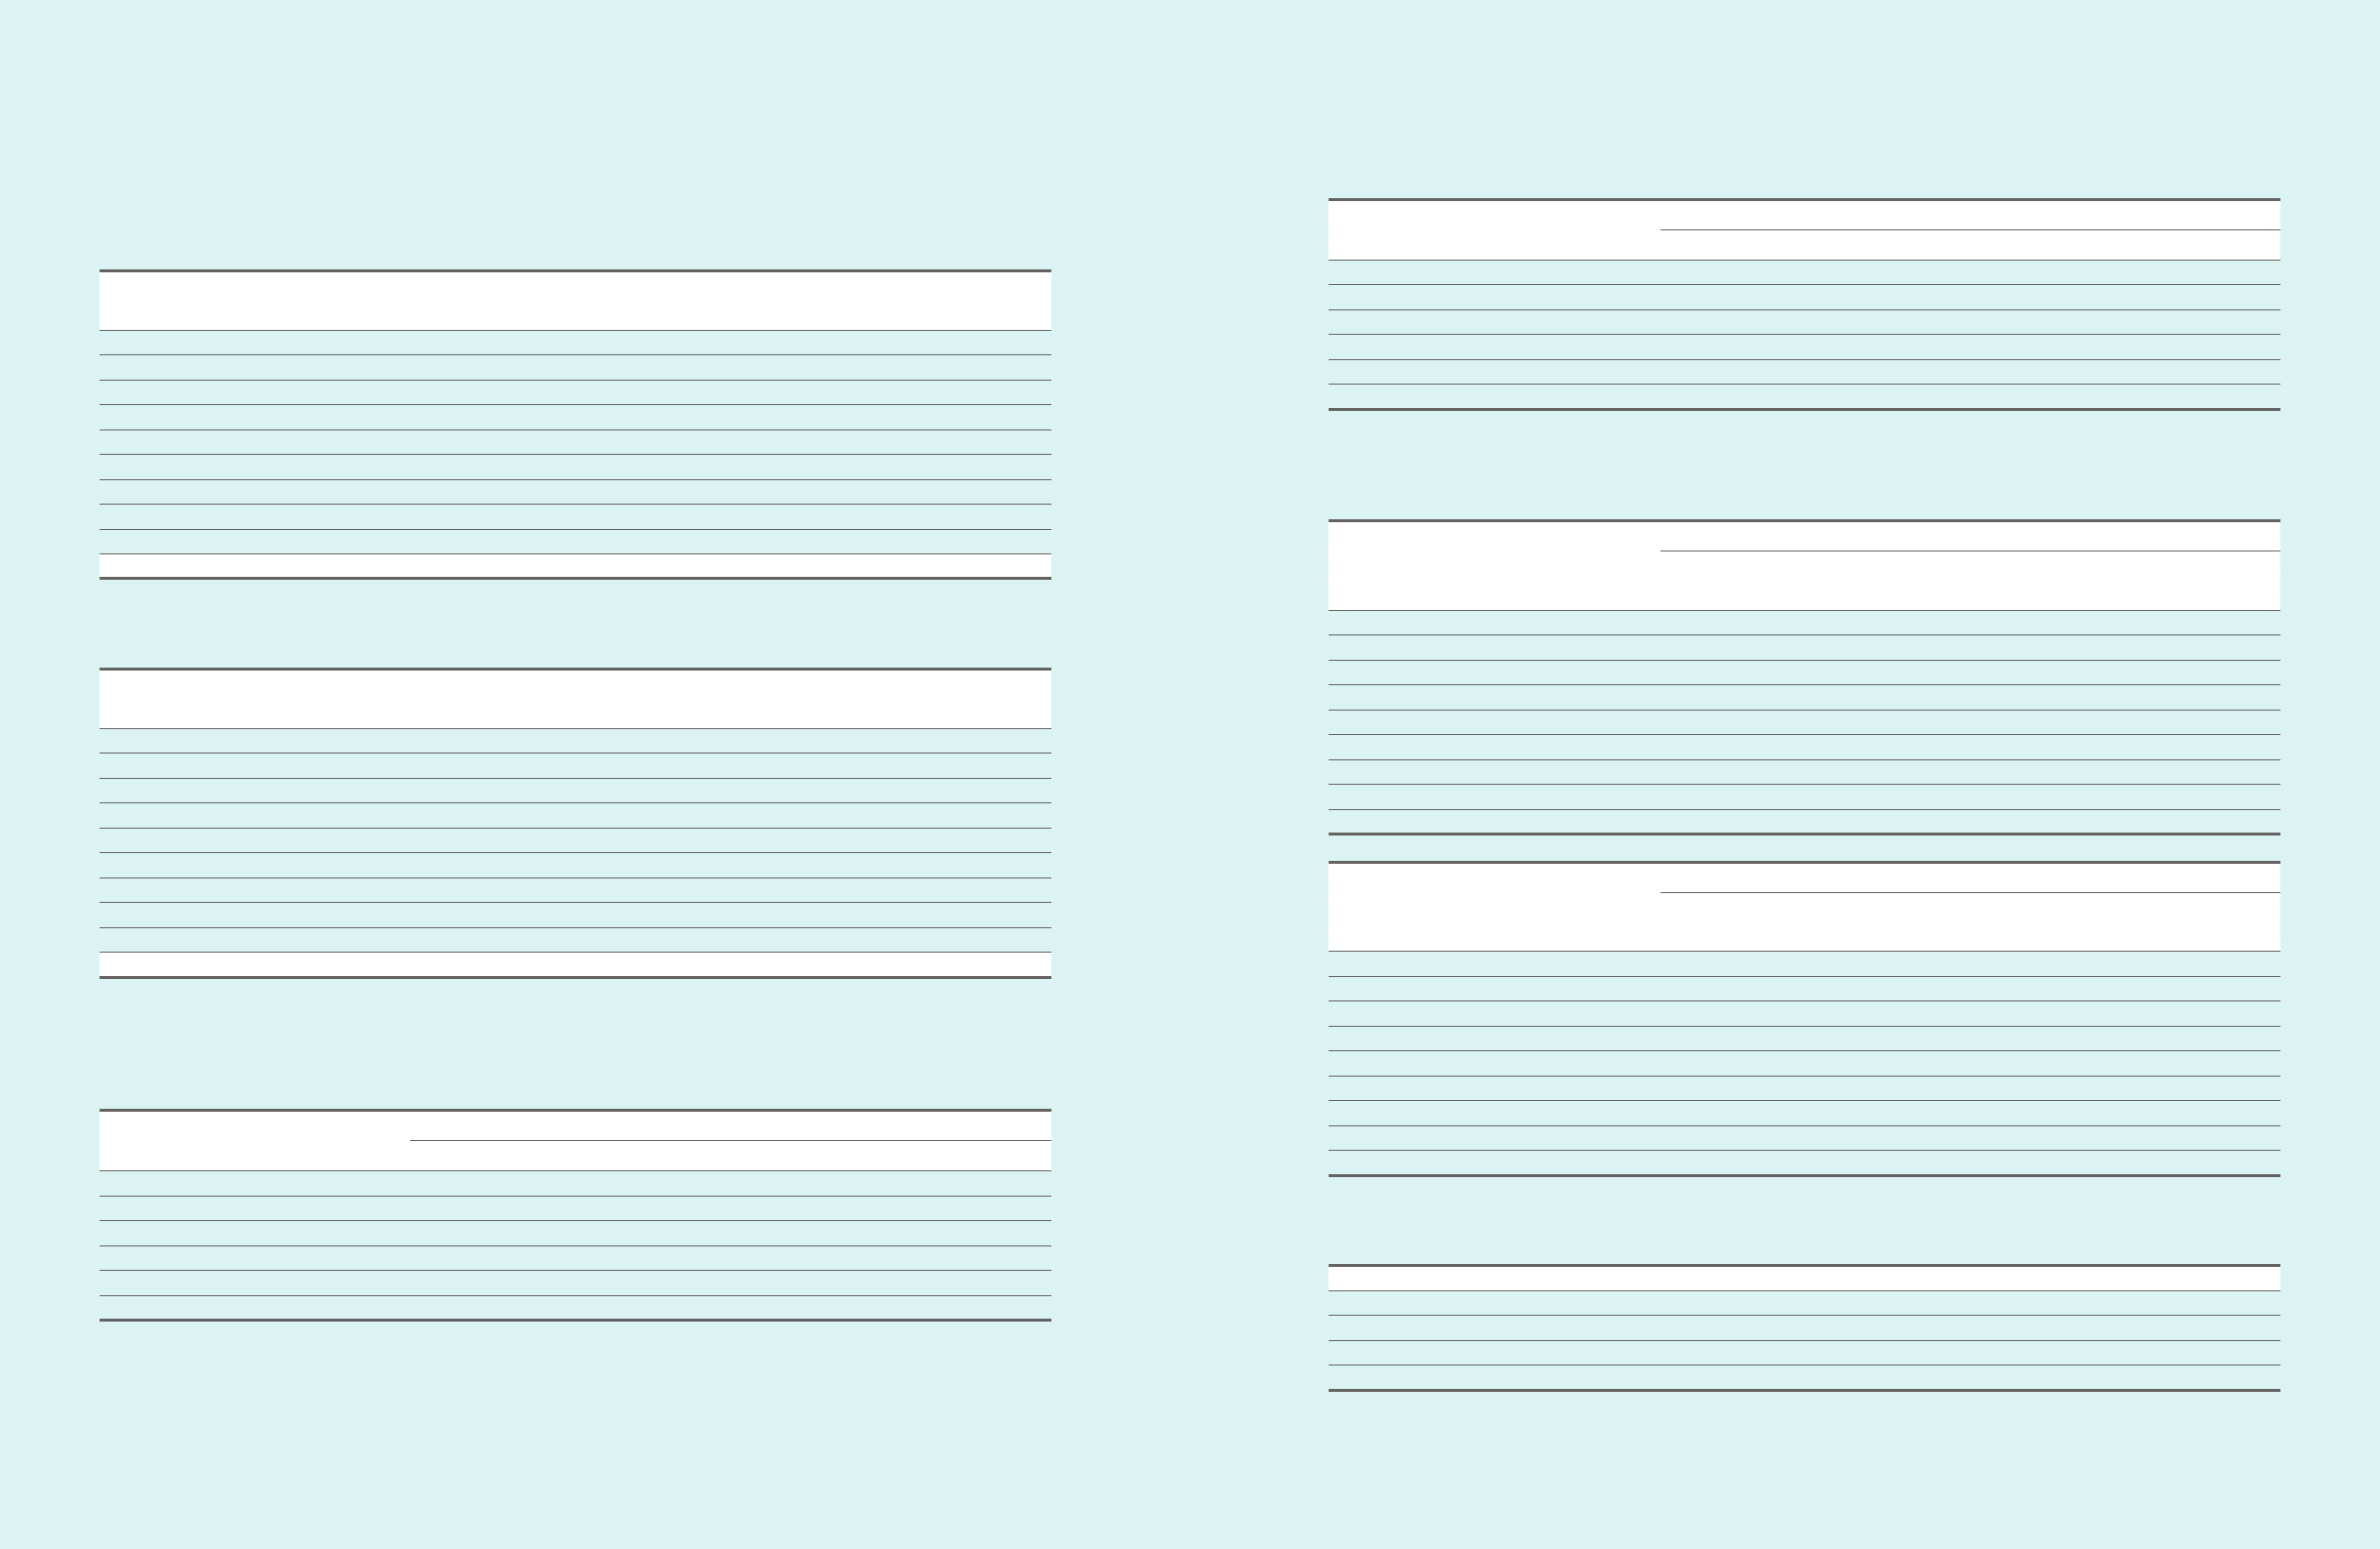
E) Financial information of associates and joint ventures as of and for the year ended December 31, 2011 and 2010, are as follows :
(1) Associates
(In millions of Korean Won)
Investee
2011
Assets Liabilities Sales Net Income
Samsung Card ₩16,135,253 ₩9,991,910 ₩3,196,455 ₩374,831
Samsung Electro-Mechanics 7,455,731 3,579,943 7,624,623 349,473
Samsung SDI 8,527,411 2,212,884 5,443,883 320,109
Samsung SDS 4,027,597 1,057,695 4,765,178 324,767
Samsung Techwin 3,223,454 1,582,808 3,171,532 241,014
Samsung LED 1,454,193 831,104 1,292,245 64,783
(In millions of Korean Won)
Investee
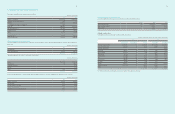
2010
Assets Liabilities Sales Net Income
Samsung Card ₩12,514,046 ₩6,469,882 ₩3,277,297 ₩1,156,217
Samsung Electro-Mechanics 6,835,958 3,033,118 6,968,880 666,716
Samsung SDI 7,933,567 1,702,706 5,124,275 385,112
Samsung SDS 3,653,483 1,013,265 4,329,994 327,635
Samsung Techwin 2,897,943 1,627,311 3,197,875 234,198
Samsung LED 1,339,967 788,602 1,317,753 204,399
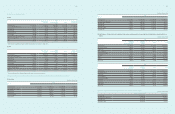
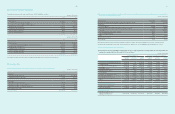
(2) Joint Ventures - A listing of interests in significant joint ventures and the proportion of ownership interest held in jointly controlled entities is as
follows :
(In millions of Korean Won)
2011
Samsung
Corning
Precision Materials
Siltronic
Samsung
Wafer
Others Total
Current Assets ₩1,759,181 ₩100,952 ₩176,899 ₩2,037,032
Non-Current Assets 1,742,956 343,751 40,346 2,127,053
Total Assets 3,502,137 444,703 217,245 4,164,085
Current Liabilities 251,287 76,932 138,217 466,436
Non-Current Liabilities 59,773 300,929 - 360,702
Net Assets 3,191,077 66,842 79,028 3,336,947
Sales 2,066,427 157,084 749,809 2,973,320
Expense 1,086,094 194,764 740,522 2,021,380
Net income 980,333 (37,680) 9,287 951,940
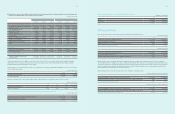
2010
Samsung
Corning
Precision Materials
Siltronic
Samsung
Wafer
Others Total
Current Assets ₩1,498,347 ₩76,031 ₩199,360 ₩1,773,738
Non-Current Assets 1,295,109 380,371 10,887 1,686,367
Total Assets 2,793,456 456,402 210,247 3,460,105
Current Liabilities 352,724 62,016 167,221 581,961
Non-Current Liabilities 9,484 289,317 - 298,801
Net Assets 2,431,248 105,069 43,026 2,579,343
Total Sales 2,486,564 149,340 931,262 3,567,166
Total Expense 1,085,202 185,837 907,307 2,178,346
Net income 1,401,362 (36,497) 23,955 1,388,820
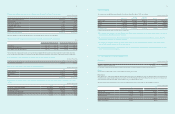
F) Fair value of marketable shares held by associates as of December 31, 2011, is as follows :
(In millions of Korean Won)
Number of shares held Market value
Samsung SDI ₩9,282,753 ₩1,239,248
Samsung Electro-Mechanics 17,693,084 1,374,753
Samsung Card 43,393,170 1,687,994
Samsung Techwin 13,526,935 719,633