Samsung 2011 Annual Report Download - page 20
Download and view the complete annual report
Please find page 20 of the 2011 Samsung annual report below. You can navigate through the pages in the report by either clicking on the pages listed below, or by using the keyword search tool below to find specific information within the annual report.-
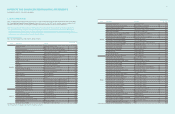
 1
1 -
2
-
3
-
4
-
5
-
6
-
7
-
8
-
9
-
 10
10 -
 11
11 -
 12
12 -
 13
13 -
 14
14 -
 15
15 -
 16
16 -
 17
17 -
 18
18 -
 19
19 -
 20
20 -
 21
21 -
 22
22 -
 23
23 -
 24
24 -
 25
25 -
 26
26 -
 27
27 -
 28
28 -
 29
29 -
 30
30 -
31
-
32
-
33
-
34
-
35
-
36
-
37
-
38
-
39
-
40
-
41
-
42
-
43
-
44
-
45
-
46
-
47
-
48
-
49
-
50
-
51
-
52
 |
 |

34
35
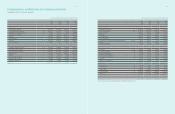
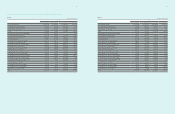
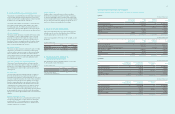
(In millions of Korean won, in thousands of U.S. dollars (Note 2.27))
Notes 2011 2010 2011 2010
KRW KRW USD USD
Revenue 165,001,771 154,630,328 143,069,254 134,076,414
Cost of sales 23 112,14 5,120 102,666,824 97,2 38,4 63 89,020,051
Gross profit 52,856,651 51,963,504 45,830,791 45,056,363
Research and development expenses 23 9,979,841 9,099,352 8,653,291 7,889,840
Selling, general and administrative expenses 23, 24 27,421,910 26, 243,122 23,776,910 22,754,810
Other operating income 25 2,421,909 1,755,441 2,099,981 1,522,104
Other operating expenses 25 1,627,092 1,079,935 1,410,814 936,387
Operating profit 16,249,717 17,296,536 14,089,757 14,9 97,430
Share of profit or loss of associates and joint ventures 1, 39 9,194 2,2 67,0 91 1,213,209 1,965,743
Finance income 26 7,403,525 7,4 65,128 6,419,427 6,472,841
Finance expense 26 7,893,421 7,7 0 0, 0 9 9 6,844,204 6,676,579
Profit before income tax 17,159,015 19,328,656 14,878,189 16,759,435
Income tax expense 27 3,424,948 3,182,131 2,969,694 2,759,153
Profit for the year 13,734,067 16,146,525 11,90 8,495 14,000,282
Profit attributable to owners of the parent 13,359,192 15,799,035 11,583,449 13,698,981
Profit attributable to non-controlling interests 374,875 347,4 90 325,046 301,301
Earnings per share for profit attributable to the owners
of the parent (in Korean won and US dollars) : 28
Basic 89,073 105,992 77. 23 91.90
Diluted 88,990 105,672 77.16 91.63
The accompanying notes are an integral part of these consolidated financial statements.
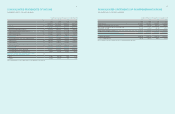
(In millions of Korean won, in thousands of U.S. dollars (Note 2.27))
2011 2010 2011 2010
KRW KRW USD USD
Profit for the year 13,734,067 16,146,525 11,908,495 14,000,282
Available-for-sale financial assets, net of tax (572,028) 932,384 (495,992) 808,449
Share of other comprehensive income of associates and
joint ventures, net of tax (113,898) 387,457 (98,758) 335,955
Foreign currency translation, net of tax 183,655 (178,357) 159,243 (154,649)
Total consolidated comprehensive income 13,231,796 17,288,009 11,472,988 14,990,037
Consolidated comprehensive income attributable to :
Owners of the parent 12,801,542 16,901,117 11,0 99,924 14,654,571
Non-controlling interests 430,254 386,892 373,064 335,466
The accompanying notes are an integral part of these consolidated financial statements.
CONSOLIDATED STATEMENTS OF INCOME
Samsung Electronics Co., Ltd. and its subsidiaries
CONSOLIDATED STATEMENTS OF COMPREHENSIVE INCOME
Samsung Electronics Co., Ltd. and its subsidiaries