Samsung 2011 Annual Report Download - page 22
Download and view the complete annual report
Please find page 22 of the 2011 Samsung annual report below. You can navigate through the pages in the report by either clicking on the pages listed below, or by using the keyword search tool below to find specific information within the annual report.-
 1
1 -
2
-
3
-
4
-
5
-
6
-
7
-
8
-
9
-
10
-
11
-
 12
12 -
 13
13 -
 14
14 -
 15
15 -
 16
16 -
 17
17 -
 18
18 -
 19
19 -
 20
20 -
 21
21 -
 22
22 -
 23
23 -
 24
24 -
 25
25 -
 26
26 -
 27
27 -
 28
28 -
 29
29 -
 30
30 -
 31
31 -
 32
32 -
33
-
34
-
35
-
36
-
37
-
38
-
39
-
40
-
41
-
42
-
43
-
44
-
45
-
46
-
47
-
48
-
49
-
50
-
51
-
52
 |
 |
38
39
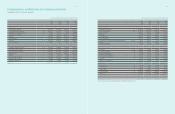
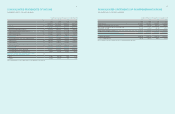
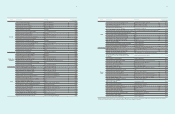
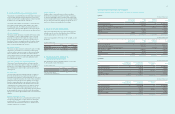
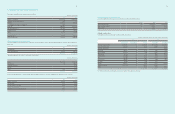
CONSOLIDATE STATEMENTS OF CASH FLOWS
Samsung Electronics Co., Ltd. and its subsidiaries
(In millions of Korean won, in thousands of U.S. dollars (Note 2.27))
For the years ended December 31
Notes 2011 2010 2011 2010
KRW KRW USD USD
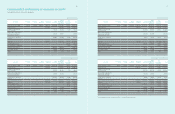
Cash flows from operating activities
Profit for the year 13,734,067 16,146,525 11,908,495 14,000,282
Adjustments 29 16,475,605 14,088,323 14,285,620 12,215,662
Changes in operating assets and liabilities 29 (4,057,345) (5,668,035) (3,518,031) (4,914,623)
Cash flows from operating activities 26,152,327 24,566,813 22,676,084 21,301,321
Interest received 755,859 457,50 8 655,388 396,695
Interest paid (641,462) (582,292) (556,197) (504,892)
Dividend received 628,585 1,520,037 545,032 1,317,9 89
Income tax paid (3,977,408) (2,135,287) (3,448,719) (1,851,458)
Net cash generated from Operating activities 22,917,901 23,826,779 19,871,588 20,659,655
Cash flows from investing activities
Net decrease (increase) in short-term financial instruments 75,666 (2,991,820) 65,608 (2,594,139)
Net decrease in short-term available-for-sale financial assets 518,479 981,599 449,561 851,122
Proceeds from disposal of long-term available-for-sale financial assets 415,096 9,207 359,920 7,9 83
Acquisition of long-term available-for-sale financial assets (419,678) (414,978) (363,893) (359,818)
Proceeds from disposal of associates and joint ventures 306,804 277,907 266,023 240,967
Acquisition of associates and joint ventures (403,538) (243) (349,899) (211)
Disposal of property and equipment 379,878 1,228,007 329,384 1,064,777
Purchases of property and equipment (21,965,678) (21,619,244) (19,045,936) (18,745,551)
Disposal of intangible assets 9,703 16,620 8,413 14,411
Purchases of intangible assets (663,678) (1,259,895) (575,460) (1,092,426)
Proceeds from deposits 461,454 366,304 40 0,116 317,614
Payment for deposits (594,067) (420,986) (515,102) (365,027)
Cash inflows (outflows) from business combination (522,740) 47,5 49 (453,256) 41,229
Cash inflows from disposal of business 925,454 179,437 802,440 155,586
Others 364,281 (384,341) 315,860 (333,253)
Net cash used in investing activities (21,112,564) (23,984,877) (18,306,221) (20,796,736)
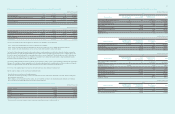
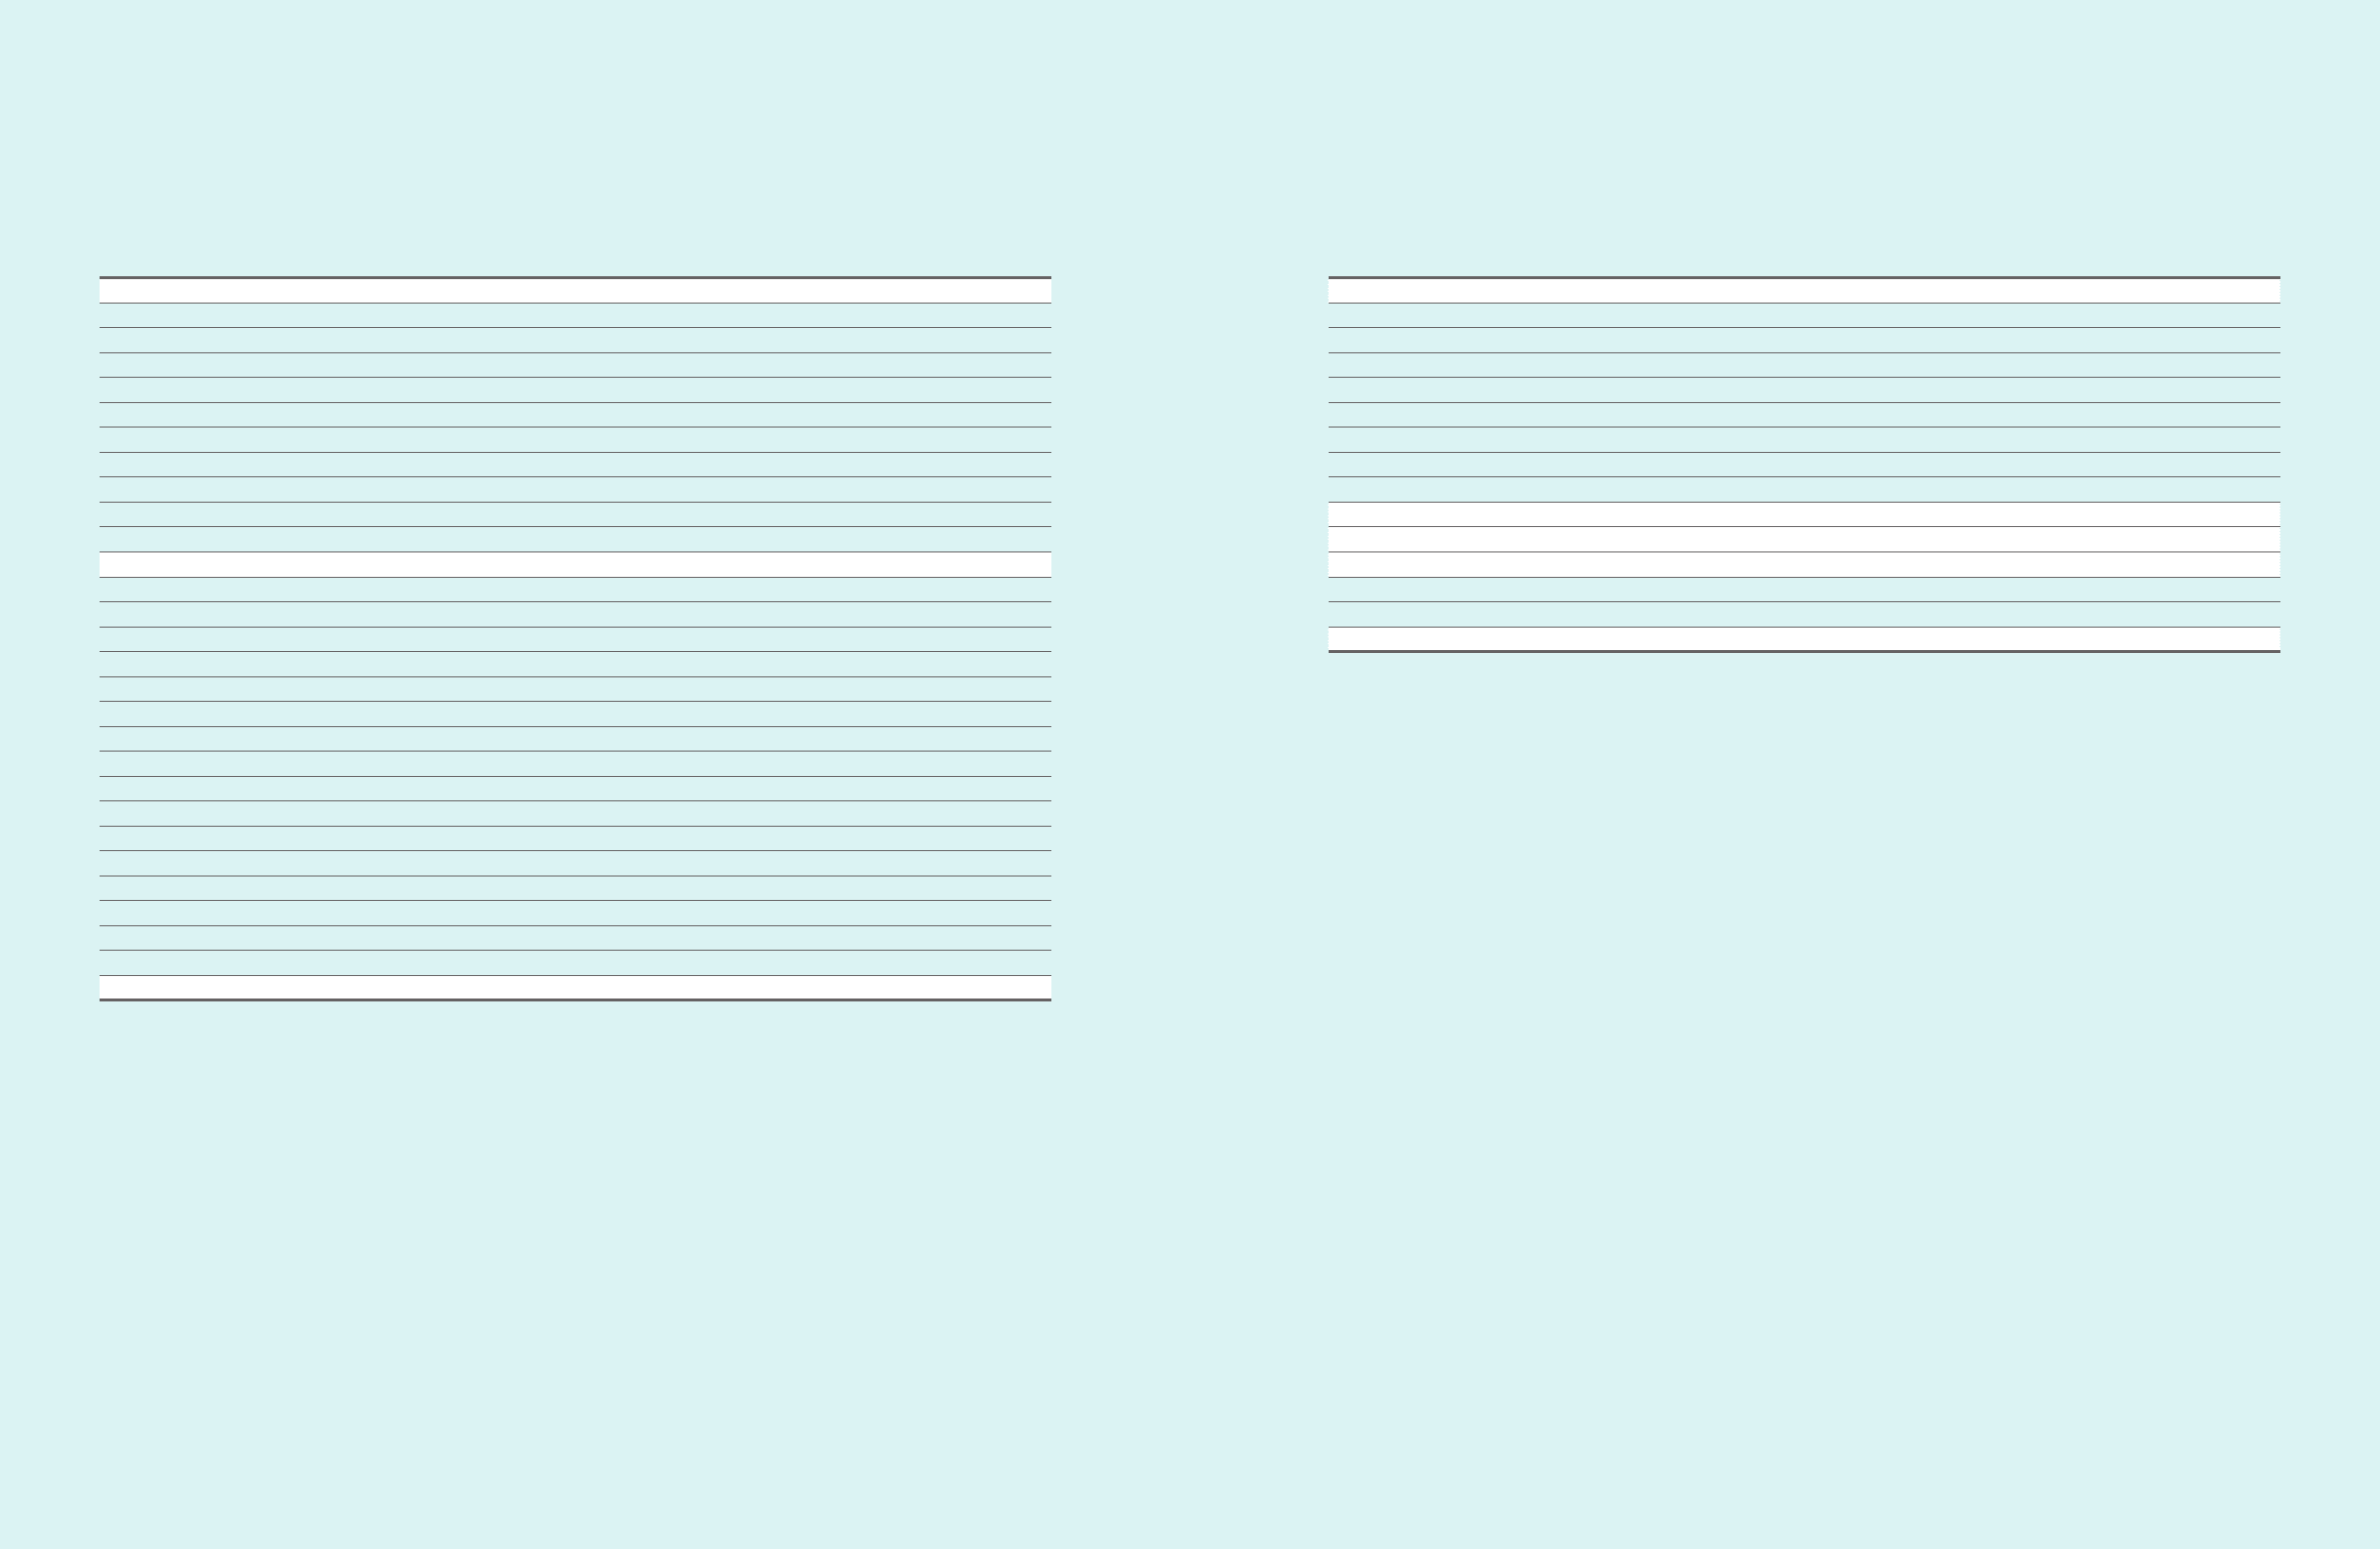
(In millions of Korean won, in thousands of U.S. dollars (Note 2.27))
For the years ended December 31
Notes 2011 2010 2011 2010
KRW KRW USD USD
Cash flows from financing activities
Net proceeds from short-term borrowings 97 7,315 868,156 847,4 07 752,758
Disposal of treasury stock 160,827 184,291 139,449 159,795
Proceeds from debentures and long-term borrowings 3,925,406 1,137,6 46 3,403,630 986,427
Repayment of debentures and long-term borrowings (1,145,167) (304,074) (992,948) (263,656)
Payment of dividends (874,608) (1,917,637) (758,353) (1,662,739)
Others 65,956 (120,677) 57,189 (104,636)
Net cash provided by (used in) financing activities 3,109,729 (152,295) 2,696,374 (132,051)
Effect of exchange rate changes on cash and cash equivalents (14,724) (48,118) (12,767) (41,722)
Net increase (decrease) in cash and cash equivalents 4,900,342 (358,511) 4,248,974 (310,854)
Cash and cash equivalents
Beginning of the year 9,791,419 10,149,930 8,489,915 8,800,769
End of the year 14,691,761 9,791,419 12,738,889 8,489,915
The accompanying notes are an integral part of these consolidated financial statements.