Saks Fifth Avenue 2010 Annual Report Download - page 88
Download and view the complete annual report
Please find page 88 of the 2010 Saks Fifth Avenue annual report below. You can navigate through the pages in the report by either clicking on the pages listed below, or by using the keyword search tool below to find specific information within the annual report.-
 1
1 -
2
-
3
-
4
-
5
-
6
-
7
-
8
-
9
-
10
-
11
-
12
-
13
-
14
-
15
-
16
-
17
-
18
-
19
-
20
-
21
-
22
-
23
-
24
-
25
-
26
-
27
-
28
-
29
-
30
-
31
-
32
-
33
-
34
-
35
-
36
-
37
-
38
-
39
-
40
-
41
-
42
-
43
-
44
-
45
-
46
-
47
-
48
-
49
-
50
-
51
-
52
-
53
-
54
-
55
-
56
-
57
-
58
-
59
-
60
-
61
-
62
-
63
-
64
-
65
-
66
-
67
-
68
-
69
-
70
-
71
-
72
-
73
-
74
-
75
-
76
-
77
-
 78
78 -
 79
79 -
 80
80 -
 81
81 -
 82
82 -
 83
83 -
 84
84 -
 85
85 -
 86
86 -
 87
87 -
 88
88 -
 89
89 -
 90
90 -
 91
91 -
 92
92 -
 93
93 -
 94
94 -
 95
95 -
 96
96 -
 97
97 -
 98
98 -
99
-
100
-
101
-
102
-
103
-
104
-
105
-
106
-
107
-
108
-
109
-
110
-
111
-
112
-
113
-
114
-
115
-
116
-
117
-
118
-
119
-
120
-
121
-
122
-
123
-
124
-
125
-
126
-
127
-
128
-
129
-
130
-
131
-
132
-
133
 |
 |

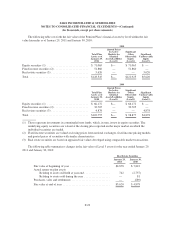
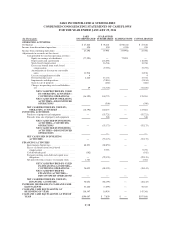
SAKS INCORPORATED & SUBSIDIARIES
CONDENSED CONSOLIDATING STATEMENTS OF CASH FLOWS
FOR THE YEAR ENDED JANUARY 29, 2011
(In Thousands)
SAKS
INCORPORATED
GUARANTOR
SUBSIDIARIES ELIMINATIONS CONSOLIDATED
OPERATING ACTIVITIES
Net Income .................................... $ 47,846 $ 78,441 $(78,441) $ 47,846
Income from discontinued operations ................ 450 450 (450) 450
Income from continuing operations ................. 47,396 77,991 (77,991) 47,396
Adjustments to reconcile net loss to net
Cash provided by (used in) operating activities:
Equity in earnings of subsidiaries ........... (77,991) — 77,991 —
Depreciation and amortization ............. 118,696 118,696
Stock-based compensation ................ 16,766 16,766
Excess tax benefit from stock-based
compensation ........................ (9,793) (9,793)
Amortization of discount on convertible
notes ............................... 11,910 11,910
Loss on extinguishment of debt ............ 4 4
Deferred income taxes ................... 2,220 15,134 17,354
Impairments and dispositions .............. (2,814) (2,814)
Gain on sale of property .................. (482) (482)
Changes in operating assets and liabilities,
net ................................. 69 (74,725) (74,656)
NET CASH PROVIDED BY (USED
IN) OPERATING ACTIVITIES—
CONTINUING OPERATIONS .... (16,392) 140,773 — 124,381
NET CASH USED IN OPERATING
ACTIVITIES—DISCONTINUED
OPERATIONS .................. (500) (500)
NET CASH PROVIDED BY (USED IN)
OPERATING ACTIVITIES ............... (16,392) 140,273 — 123,881
INVESTING ACTIVITIES
Purchases of property and equipment ............ — (55,721) — (55,721)
Proceeds from sale of property and equipment .... 548 548
NET CASH USED IN INVESTING
ACTIVITIES—CONTINUING
OPERATIONS .................. — (55,173) — (55,173)
NET CASH USED IN INVESTING
ACTIVITIES—DISCONTINUED
OPERATIONS .................. — —
NET CASH USED IN INVESTING
ACTIVITIES ............................ — (55,173) — (55,173)
FINANCING ACTIVITIES
Intercompany borrowings ..................... 68,853 (68,853) — —
Excess tax benefit from stock-based
compensation ............................ 9,793 9,793
Cash dividends paid ......................... (102) (102)
Payments on long-term debt and capital lease
obligations ............................... — (29,135) (29,135)
Net proceeds from issuance of common stock ..... 1,301 1,301
NET CASH PROVIDED BY (USED
IN) FINANCING ACTIVITIES—
CONTINUING OPERATIONS .... 70,052 (88,195) — (18,143)
NET CASH PROVIDED BY
FINANCING ACTIVITIES—
DISCONTINUED OPERATIONS .. — — — —
NET CASH PROVIDED BY (USED IN)
FINANCING ACTIVITIES ................ 70,052 (88,195) — (18,143)
INCREASE (DECREASE) IN CASH AND CASH
EQUIVALENTS ............................. 53,660 (3,095) — 50,565
CASH AND CASH EQUIVALENTS AT
BEGINNING OF YEAR ...................... 136,347 10,954 — 147,301
CASH AND CASH EQUIVALENTS AT END OF
YEAR ...................................... $190,007 $ 7,859 $ — $197,866
F-38