Saks Fifth Avenue 2010 Annual Report Download - page 66
Download and view the complete annual report
Please find page 66 of the 2010 Saks Fifth Avenue annual report below. You can navigate through the pages in the report by either clicking on the pages listed below, or by using the keyword search tool below to find specific information within the annual report.-
 1
1 -
2
-
3
-
4
-
5
-
6
-
7
-
8
-
9
-
10
-
11
-
12
-
13
-
14
-
15
-
16
-
17
-
18
-
19
-
20
-
21
-
22
-
23
-
24
-
25
-
26
-
27
-
28
-
29
-
30
-
31
-
32
-
33
-
34
-
35
-
36
-
37
-
38
-
39
-
40
-
41
-
42
-
43
-
44
-
45
-
46
-
47
-
48
-
49
-
50
-
51
-
52
-
53
-
54
-
55
-
 56
56 -
 57
57 -
 58
58 -
 59
59 -
 60
60 -
 61
61 -
 62
62 -
 63
63 -
 64
64 -
 65
65 -
 66
66 -
 67
67 -
 68
68 -
 69
69 -
 70
70 -
 71
71 -
 72
72 -
 73
73 -
 74
74 -
 75
75 -
 76
76 -
77
-
78
-
79
-
80
-
81
-
82
-
83
-
84
-
85
-
86
-
87
-
88
-
89
-
90
-
91
-
92
-
93
-
94
-
95
-
96
-
97
-
98
-
99
-
100
-
101
-
102
-
103
-
104
-
105
-
106
-
107
-
108
-
109
-
110
-
111
-
112
-
113
-
114
-
115
-
116
-
117
-
118
-
119
-
120
-
121
-
122
-
123
-
124
-
125
-
126
-
127
-
128
-
129
-
130
-
131
-
132
-
133
 |
 |

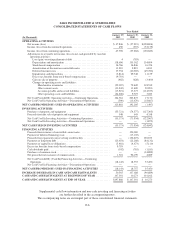
SAKS INCORPORATED & SUBSIDIARIES
NOTES TO CONSOLIDATED FINANCIAL STATEMENTS—(Continued)
(In thousands, except per share amounts)
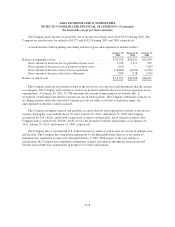
Amounts above include gross assets recorded under capital leases for buildings and equipment of $98,594
and $7,056, respectively as of January 29, 2011 and $100,730 and $4,436, respectively as of January 30, 2010.
Amortization of capital lease assets is included in depreciation expense. Accumulated depreciation of assets
recorded under capital leases was $107,914 and $106,335 as of January 29, 2011 and January 30, 2010,
respectively.
Depreciation expense was $118,669, $135,135, and $134,669 in 2010, 2009, and 2008, respectively.
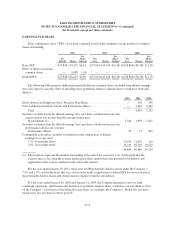
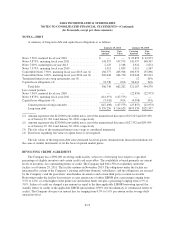
NOTE 5—INCOME TAXES
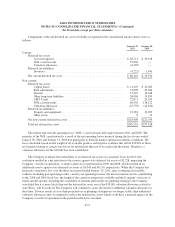
The components of income tax benefit from continuing operations were as follows:
2010 2009 2008
Current:
Federal ..................................................... $(29,664) $ (4,261) $ 1,717
State ....................................................... (1,600) 345 (839)
(31,264) (3,916) 878
Deferred:
Federal ..................................................... 16,284 (34,266) (51,177)
State ....................................................... 1,070 (6,319) 1,397
17,354 (40,585) (49,780)
Total income tax benefit from continuing operations ................. $(13,910) $(44,501) $(48,902)
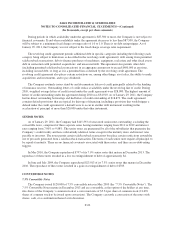
The income tax benefit from continuing operations varies from the amounts computed by applying the
statutory federal income tax rate to income before taxes. The reasons for these differences were as follows:
2010 2009 2008
Expected federal income taxes at 35% ................................. $11,720 $(35,757) $(61,434)
State income taxes, net of federal benefit .............................. 4,656 (4,267) (6,777)
State NOL valuation allowance adjustment ............................. (2,228) 3,045 6,110
Effect of tax reserve adjustments ..................................... (28,360) (5,226) 624
Executive compensation ............................................ — — 318
Change in state tax law ............................................. — — (414)
State tax rate adjustment ........................................... — (2,703) —
Write-off of expired Federal NOL .................................... — — 10,980
Other items, net .................................................. 302 407 1,691
Benefit for income taxes from continuing operations ..................... $(13,910) $(44,501) $(48,902)
F-16