Saks Fifth Avenue 2010 Annual Report Download - page 28
Download and view the complete annual report
Please find page 28 of the 2010 Saks Fifth Avenue annual report below. You can navigate through the pages in the report by either clicking on the pages listed below, or by using the keyword search tool below to find specific information within the annual report.-
 1
1 -
2
-
3
-
4
-
5
-
6
-
7
-
8
-
9
-
10
-
11
-
12
-
13
-
14
-
15
-
16
-
17
-
 18
18 -
 19
19 -
 20
20 -
 21
21 -
 22
22 -
 23
23 -
 24
24 -
 25
25 -
 26
26 -
 27
27 -
 28
28 -
 29
29 -
 30
30 -
 31
31 -
 32
32 -
 33
33 -
 34
34 -
 35
35 -
 36
36 -
 37
37 -
 38
38 -
39
-
40
-
41
-
42
-
43
-
44
-
45
-
46
-
47
-
48
-
49
-
50
-
51
-
52
-
53
-
54
-
55
-
56
-
57
-
58
-
59
-
60
-
61
-
62
-
63
-
64
-
65
-
66
-
67
-
68
-
69
-
70
-
71
-
72
-
73
-
74
-
75
-
76
-
77
-
78
-
79
-
80
-
81
-
82
-
83
-
84
-
85
-
86
-
87
-
88
-
89
-
90
-
91
-
92
-
93
-
94
-
95
-
96
-
97
-
98
-
99
-
100
-
101
-
102
-
103
-
104
-
105
-
106
-
107
-
108
-
109
-
110
-
111
-
112
-
113
-
114
-
115
-
116
-
117
-
118
-
119
-
120
-
121
-
122
-
123
-
124
-
125
-
126
-
127
-
128
-
129
-
130
-
131
-
132
-
133
 |
 |
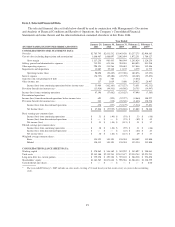
merchandise purchases and payments. The $81.5 million decrease in cash flows from continuing operations in
2010 as compared to 2009 was primarily the result of changes in working capital, driven by the increase in
inventory levels to support the increased sales for the period. The $188.7 million increase in cash flows from
continuing operations in 2009 from 2008 was primarily driven by the loss from continuing operations of $57.7
million in 2009 compared to a loss from continuing operations of $126.6 million in 2008 and a reduction in
working capital needs as a result of reduced inventory purchases in line with the 14.7% decrease in comparable
store sales.
Cash used in investing activities from continuing operations was $55.2 million in 2010, $73.9 million in
2009, and $123.0 million in 2008. Cash used in investing activities primarily relates to construction of new
stores, renovation and expansion of existing stores, and investments in support areas (e.g., technology and
distribution centers). The $18.7 million decrease in cash used in 2010 was primarily related to a decrease in
capital expenditures for the year. The $49.1 million decrease in cash used in 2009 was primarily related to a
decrease in capital expenditures of approximately $52.7 million, partially offset by a decrease in proceeds from
the sale of property and equipment of approximately $3.7 million.
Cash used in financing activities from continuing operations was $18.1 million in 2010, as compared to cash
provided by financing activities of $18.8 million in 2009 and $35.5 million in 2008. During 2010, cash used in
financing activities was primarily related to the payment of $22.9 million for the 7.5% senior notes that matured
in December 2010 and $0.8 million repurchase of the 7.0% senior notes that mature in December 2013. During
2009, cash provided by financing activities related to $120.0 million of proceeds from the issuance of the 7.5%
convertible notes and $95.1 million of proceeds, net of issuance costs, from the issuance of 14.9 million shares of
the Company’s common stock. These inflows were partially offset by the repayment of borrowings under the
revolving credit facility of $156.7 million, the early extinguishment of $23.0 million of 7.5% senior notes due in
December 2010, the payment of $13.1 million of deferred financing costs related to the 7.5% convertible notes
and the amended revolving credit facility agreement, and the payment on capital lease obligations of $4.7
million. The 2008 cash provided by financing activities related to proceeds of $156.7 million from the revolving
credit facility and $4.1 million in proceeds from the issuance of common stock associated with stock option
exercises partially offset by the repayments of long-term debt and capital lease obligations of approximately
$89.2 million and $34.9 million of common stock repurchases.
During 2010 and 2009, there were no repurchases of common stock. During 2008, the Company
repurchased approximately 2.9 million shares of its common stock at an average price of $11.83 per share and a
total cost of approximately $34.9 million. As of January 29, 2011, there were 32.7 million shares remaining
available for repurchase under the Company’s existing shares repurchase program.
CASH BALANCES AND LIQUIDITY
The Company’s primary sources of short-term liquidity are cash on hand and availability under its revolving
credit facility. In November 2009, the Company entered into an amended and restated revolving credit
agreement. The maximum borrowing capacity of the amended facility remains at $500.0 million, and the
maturity date of the amended revolving credit agreement is November 2013. As of January 29, 2011 and
January 30, 2010, the Company maintained cash and cash equivalent balances of $197.9 million and $147.3
million, respectively. Exclusive of approximately $7.9 million and $11.0 million of store operating cash as of
January 29, 2011 and January 30, 2010, respectively, cash was invested principally in money market funds,
demand deposits, and time deposits.
As of January 29, 2011, the Company had no direct borrowings under its revolving credit facility, and had
$18.9 million in unfunded letters of credit, which reduced the amount of availability under the facility.
Borrowings are limited to a prescribed percentage of eligible inventories and receivables. There are no debt
ratings-based provisions in the revolving credit facility. The facility includes a fixed-charge coverage ratio
requirement of 1.0 to 1.0 that the Company is subject to only if availability under the facility becomes less than
27