Saks Fifth Avenue 2010 Annual Report Download - page 79
Download and view the complete annual report
Please find page 79 of the 2010 Saks Fifth Avenue annual report below. You can navigate through the pages in the report by either clicking on the pages listed below, or by using the keyword search tool below to find specific information within the annual report.-
 1
1 -
2
-
3
-
4
-
5
-
6
-
7
-
8
-
9
-
10
-
11
-
12
-
13
-
14
-
15
-
16
-
17
-
18
-
19
-
20
-
21
-
22
-
23
-
24
-
25
-
26
-
27
-
28
-
29
-
30
-
31
-
32
-
33
-
34
-
35
-
36
-
37
-
38
-
39
-
40
-
41
-
42
-
43
-
44
-
45
-
46
-
47
-
48
-
49
-
50
-
51
-
52
-
53
-
54
-
55
-
56
-
57
-
58
-
59
-
60
-
61
-
62
-
63
-
64
-
65
-
66
-
67
-
68
-
 69
69 -
 70
70 -
 71
71 -
 72
72 -
 73
73 -
 74
74 -
 75
75 -
 76
76 -
 77
77 -
 78
78 -
 79
79 -
 80
80 -
 81
81 -
 82
82 -
 83
83 -
 84
84 -
 85
85 -
 86
86 -
 87
87 -
 88
88 -
 89
89 -
90
-
91
-
92
-
93
-
94
-
95
-
96
-
97
-
98
-
99
-
100
-
101
-
102
-
103
-
104
-
105
-
106
-
107
-
108
-
109
-
110
-
111
-
112
-
113
-
114
-
115
-
116
-
117
-
118
-
119
-
120
-
121
-
122
-
123
-
124
-
125
-
126
-
127
-
128
-
129
-
130
-
131
-
132
-
133
 |
 |

SAKS INCORPORATED & SUBSIDIARIES
NOTES TO CONSOLIDATED FINANCIAL STATEMENTS—(Continued)
(In thousands, except per share amounts)
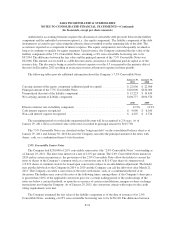
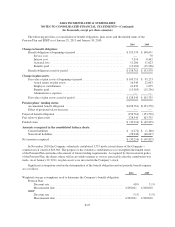
The following table sets forth the fair value of the Pension Plan’s financial assets by level within the fair
value hierarchy as of January 29, 2011 and January 30, 2010:
2010
Total Plan
Assets as of
January 29,
2011
Quoted Prices
In Active
Markets for
Identical
Assets/Liabilities
(Level 1)
Significant
Other
Observable
Inputs
(Level 2)
Significant
Unobservable
Inputs
(Level 3)
Equity securities (1) ............................. $ 71,065 $— $ 71,065 $ —
Fixed income securities (2) ........................ 51,860 — 51,860 —
Real estate securities (3) .......................... 5,620 — — 5,620
Total ......................................... $128,545 $— $122,925 $5,620
2009
Total Plan
Assets as of
January 30,
2010
Quoted Prices
In Active
Markets for
Identical
Assets/Liabilities
(Level 1)
Significant
Other
Observable
Inputs
(Level 2)
Significant
Unobservable
Inputs
(Level 3)
Equity securities (1) ............................. $ 66,172 $— $ 66,172 $ —
Fixed income securities (2) ........................ 32,705 — 32,705 —
Real estate securities (3) .......................... 4,878 — — 4,878
Total ......................................... $103,755 $— $ 98,877 $4,878
(1) These represent investments in commingled trust funds, which, in turn, invest in equity securities. The
underlying equity securities are valued at the closing price reported on the major market on which the
individual securities are traded.
(2) Fixed income securities are valued at closing prices from national exchanges, fixed income pricing models,
and quoted prices of securities with similar characteristics.
(3) Real estate securities are based on appraised fair values developed using comparable market transactions.
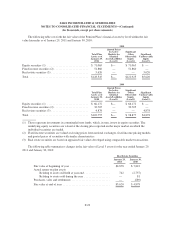
The following table summarizes changes in the fair value of Level 3 assets for the year ended January 29,
2011 and January 30, 2010:
Real Estate Securities
January 29,
2011
January 30,
2010
Fair value at beginning of year ............................ $4,878 $ 7,843
Actual return on plan assets:
Relating to assets still held at year-end .................. 742 (2,757)
Relating to assets sold during the year .................. — 81
Purchases, sales and settlements ........................... — (289)
Fair value at end of year ................................. $5,620 $ 4,878
F-29